

MONITORING CONSTRUCTION AND INDUSTRIAL SITES WITH RGB AND THERMAL ORTHOPHOTO TIME LAPSE
Comparison across dates, orthophoto time lapse and custom applications for measurement and analysis
Sky Pictures Bulgaria provides periodic drone surveys and RGB and thermal orthophoto maps to monitor the development of construction sites, industrial facilities, infrastructure and land.
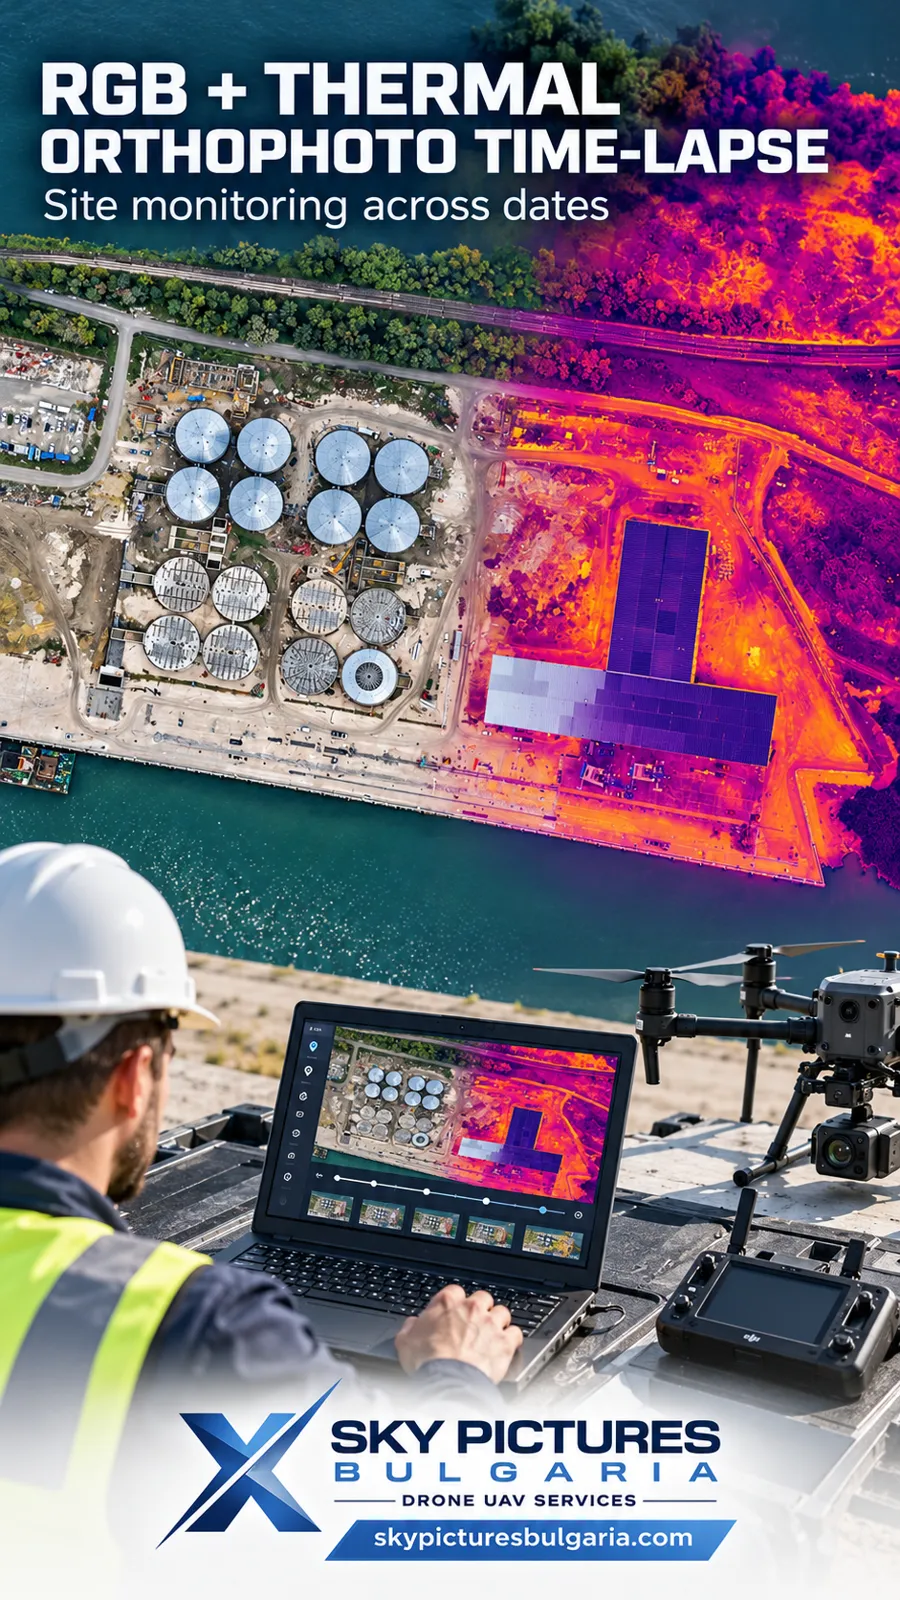
An orthophoto map is a detailed photographic plan of a site viewed vertically from above — similar to a satellite map, but created through specialist drone surveying and the processing of multiple overlapping images. Geometric correction enables spatial comparison and measurements according to the accuracy achieved.
By repeatedly surveying the same area, we create a dated sequence of maps. These reveal what has changed, where the change occurred and how the site develops over time.
Results can be delivered as:
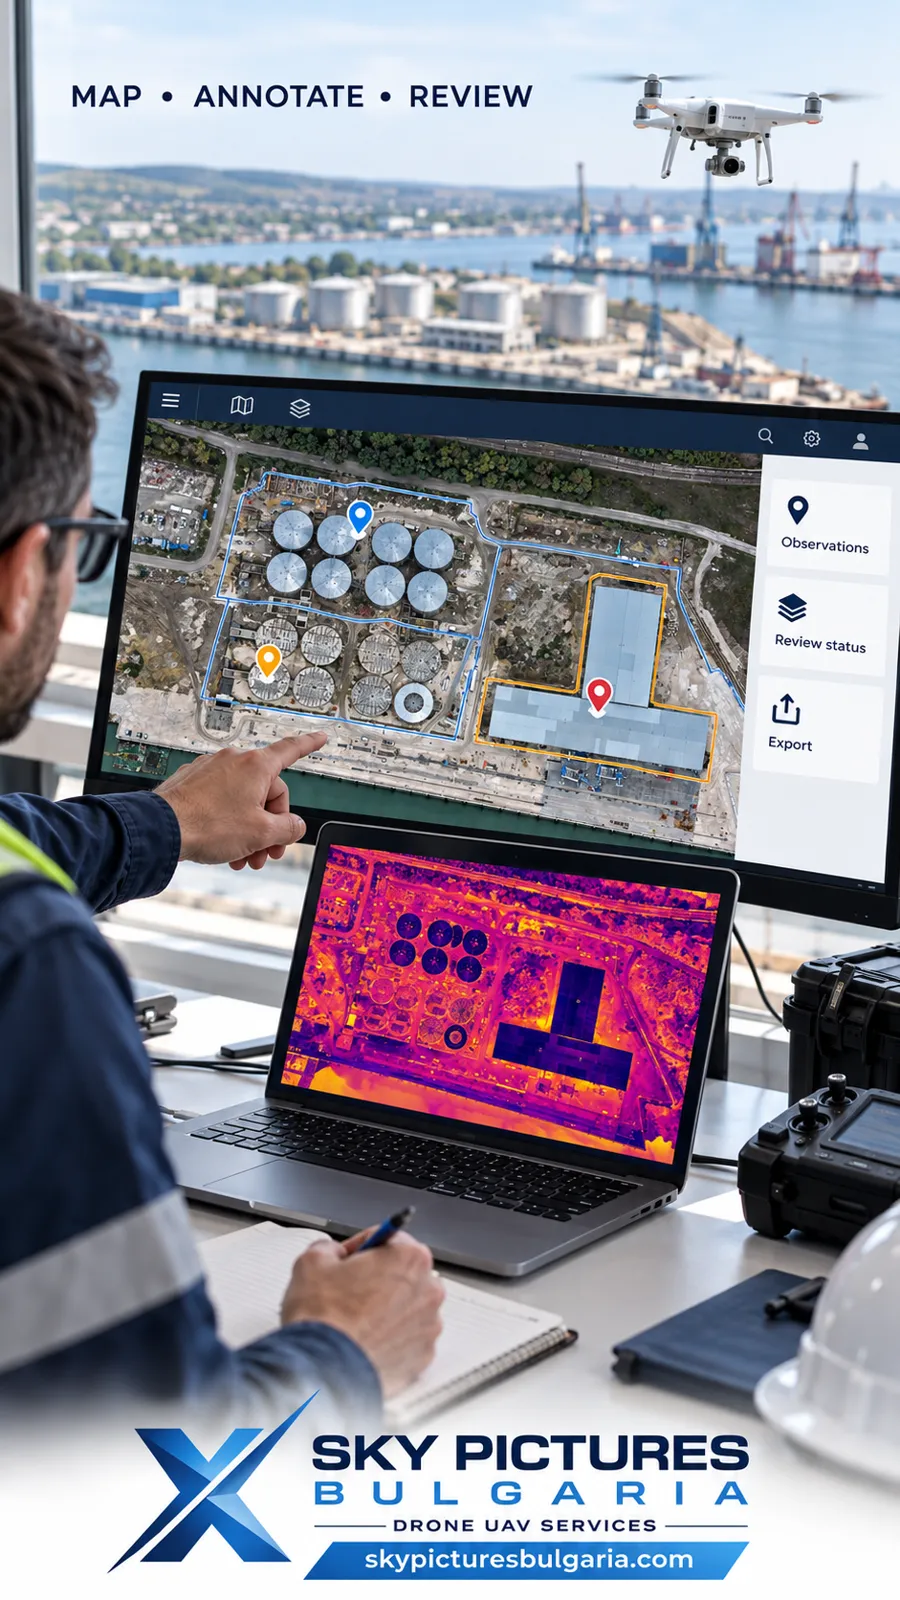
- An interactive application — for selecting dates, overlaying maps, comparing data, taking measurements and recording findings;
- RGB and thermal orthophoto time lapse — a video sequence of maps showing site development from a consistent viewpoint;
- Georeferenced maps, spatial models and analytical reports — for further use by engineers, designers, investors and technical teams;
- A combined package — a video for presenting the project and an application for detailed review and analysis.
What periodic orthophoto monitoring involves
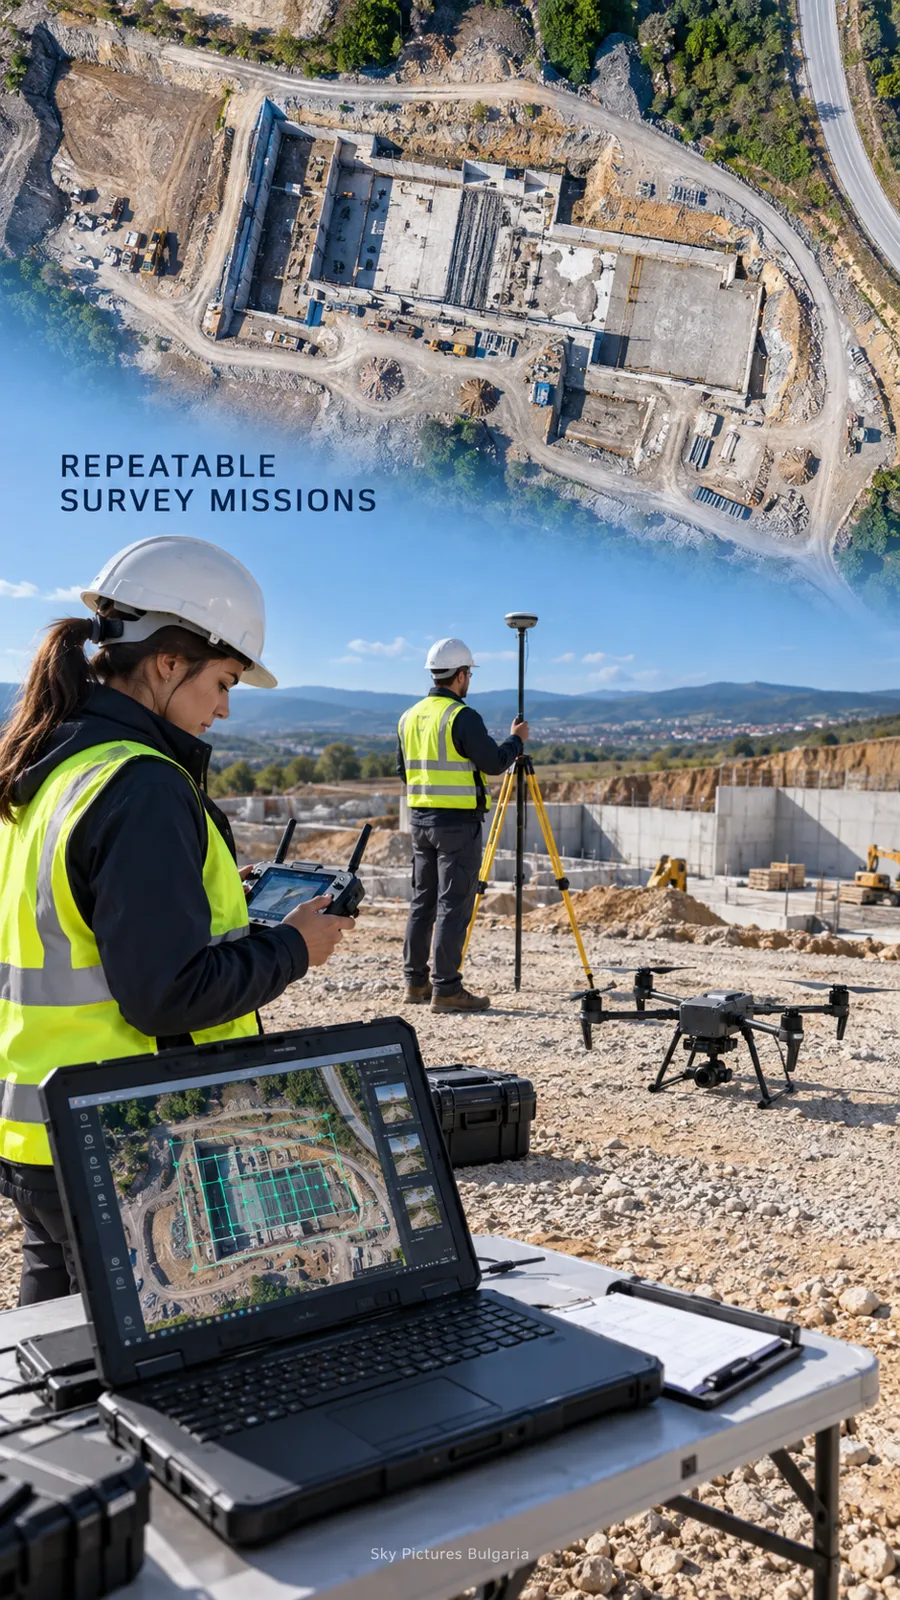
At each visit, we survey the designated area using a planned acquisition pattern. The images are processed and combined into a complete orthophoto map associated with a specific date and coordinate system.
Subsequent surveys use comparable coverage and an appropriate spatial reference so that the results can be compared.
In practice, the client receives a map based history of the site, with the ability to move between dates and examine changes.
This enables monitoring of:
- Development of construction sites and individual work areas;
- Excavation, earth fills, foundations and paving works;
- Addition, relocation or removal of structures and facilities;
- Changes in storage areas and material stockpiles;
- Construction of roads, routes and utility infrastructure;
- Development of ports, industrial complexes and energy facilities;
- Changes in terrain, vegetation, water areas and the surrounding environment.
Surveys can be daily, weekly, monthly or linked to specific construction milestones. Day by day monitoring covers the dates on which surveys have been carried out, with dates and intervals clearly identified.
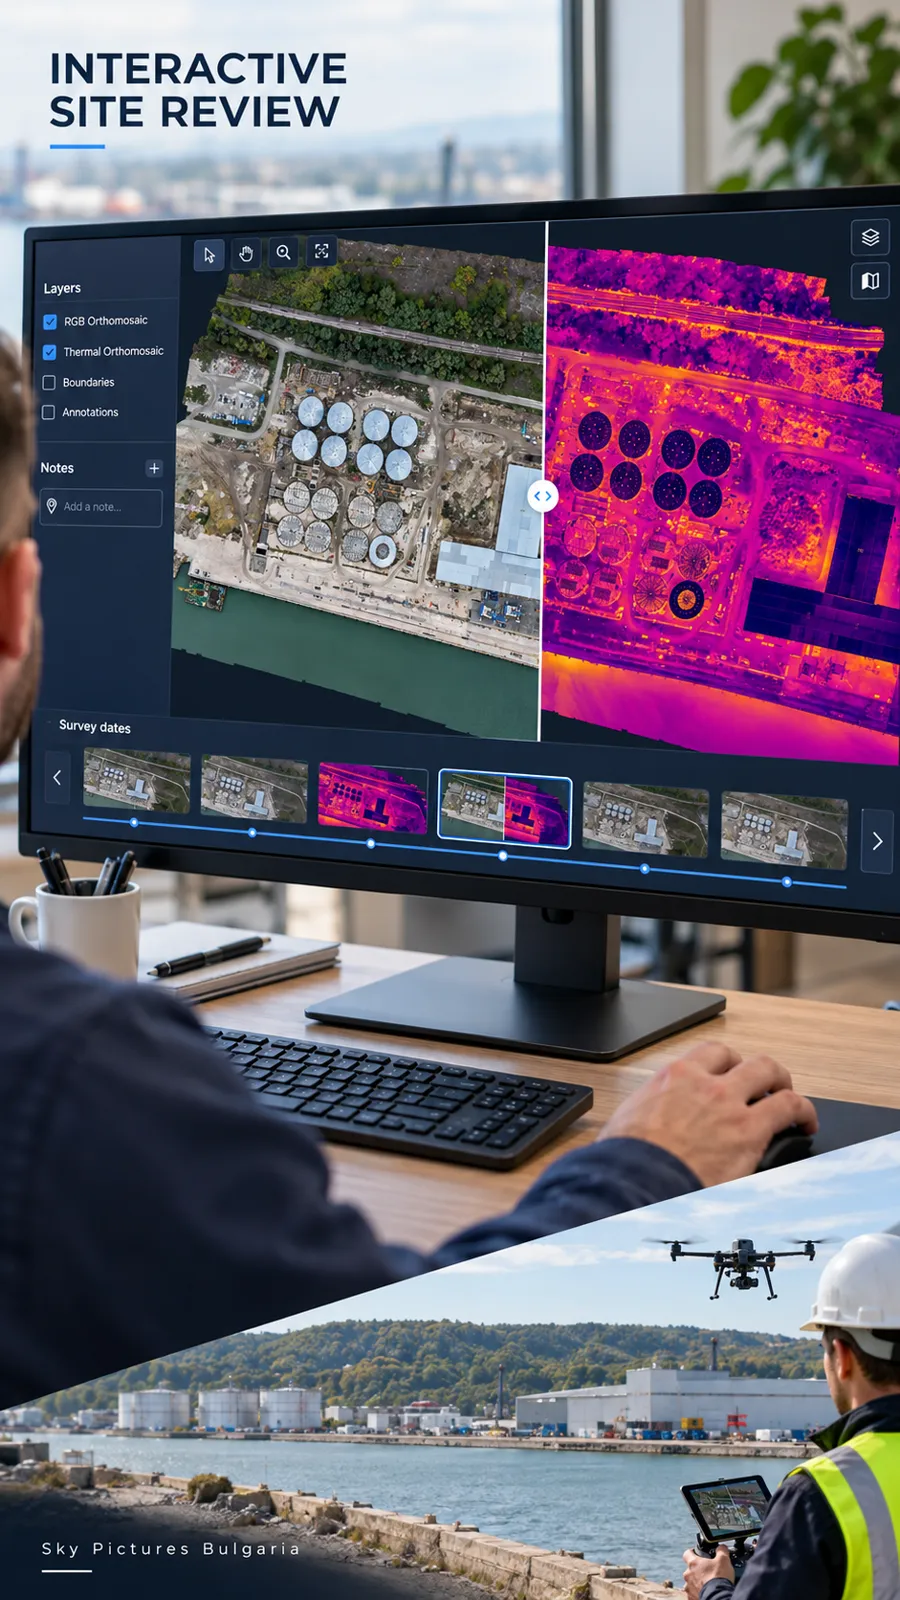
RGB and thermal orthophoto mapping
RGB orthophoto and the visible condition of the site
An RGB map shows the area in natural colours, as it would be seen through a conventional photographic camera.
It allows users to examine:
- The locations of buildings, structures, equipment and materials;
- Visible construction changes;
- Work areas, routes and temporary roads;
- The boundaries of excavations, fills and storage areas;
- Changes to paving, roofs and exposed surfaces;
- The organisation and use of the site on the relevant date.
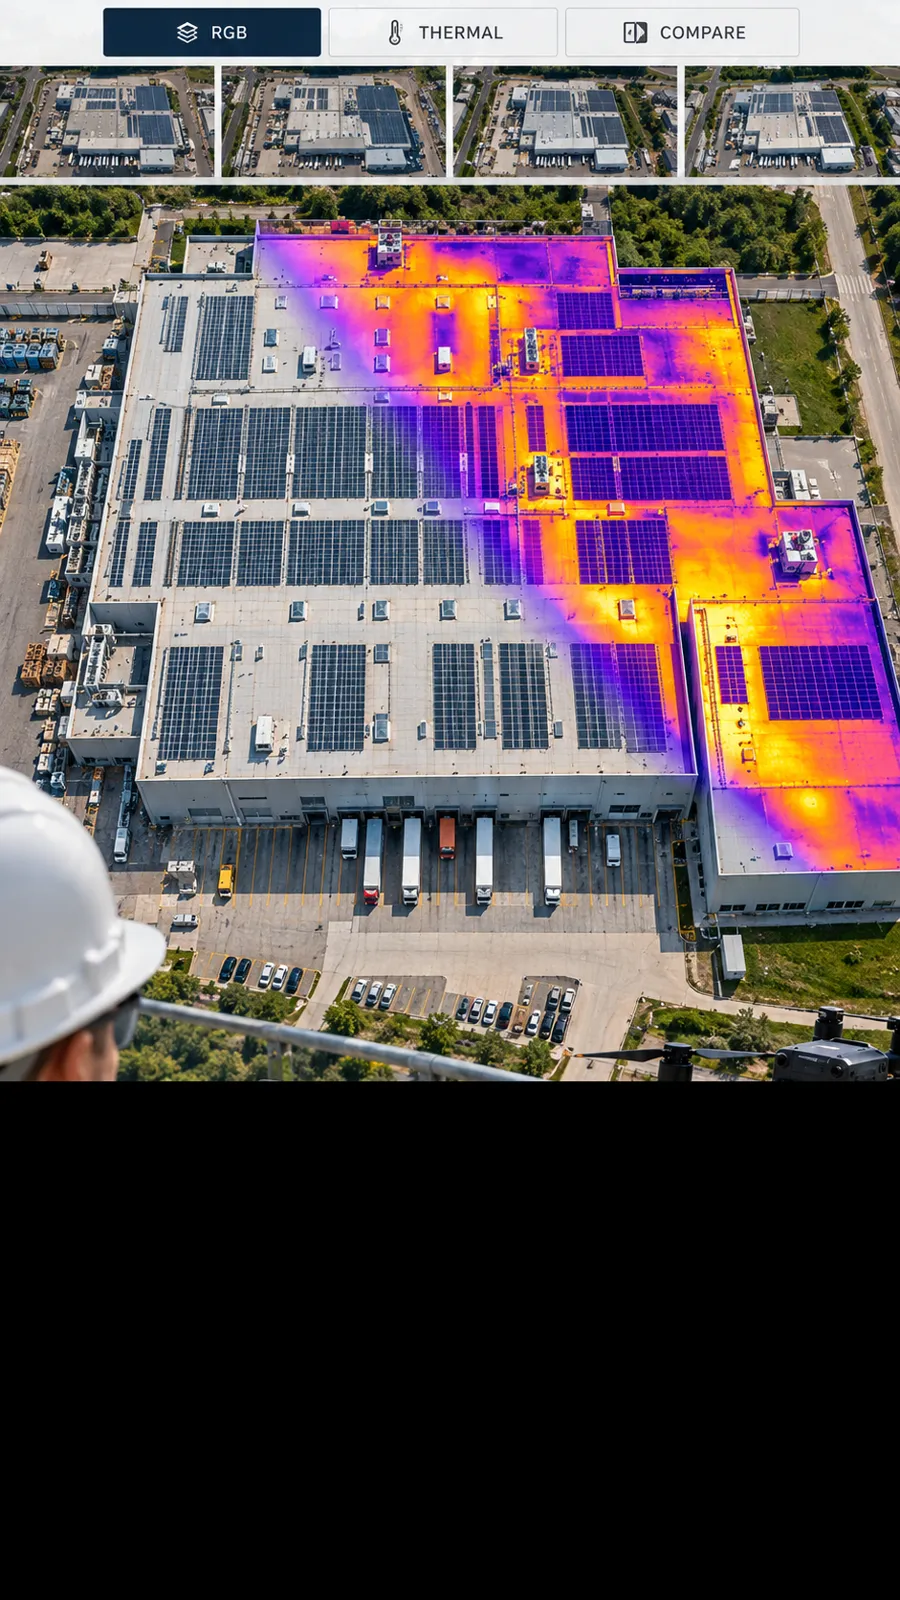
Thermal orthophoto and surface temperature distribution
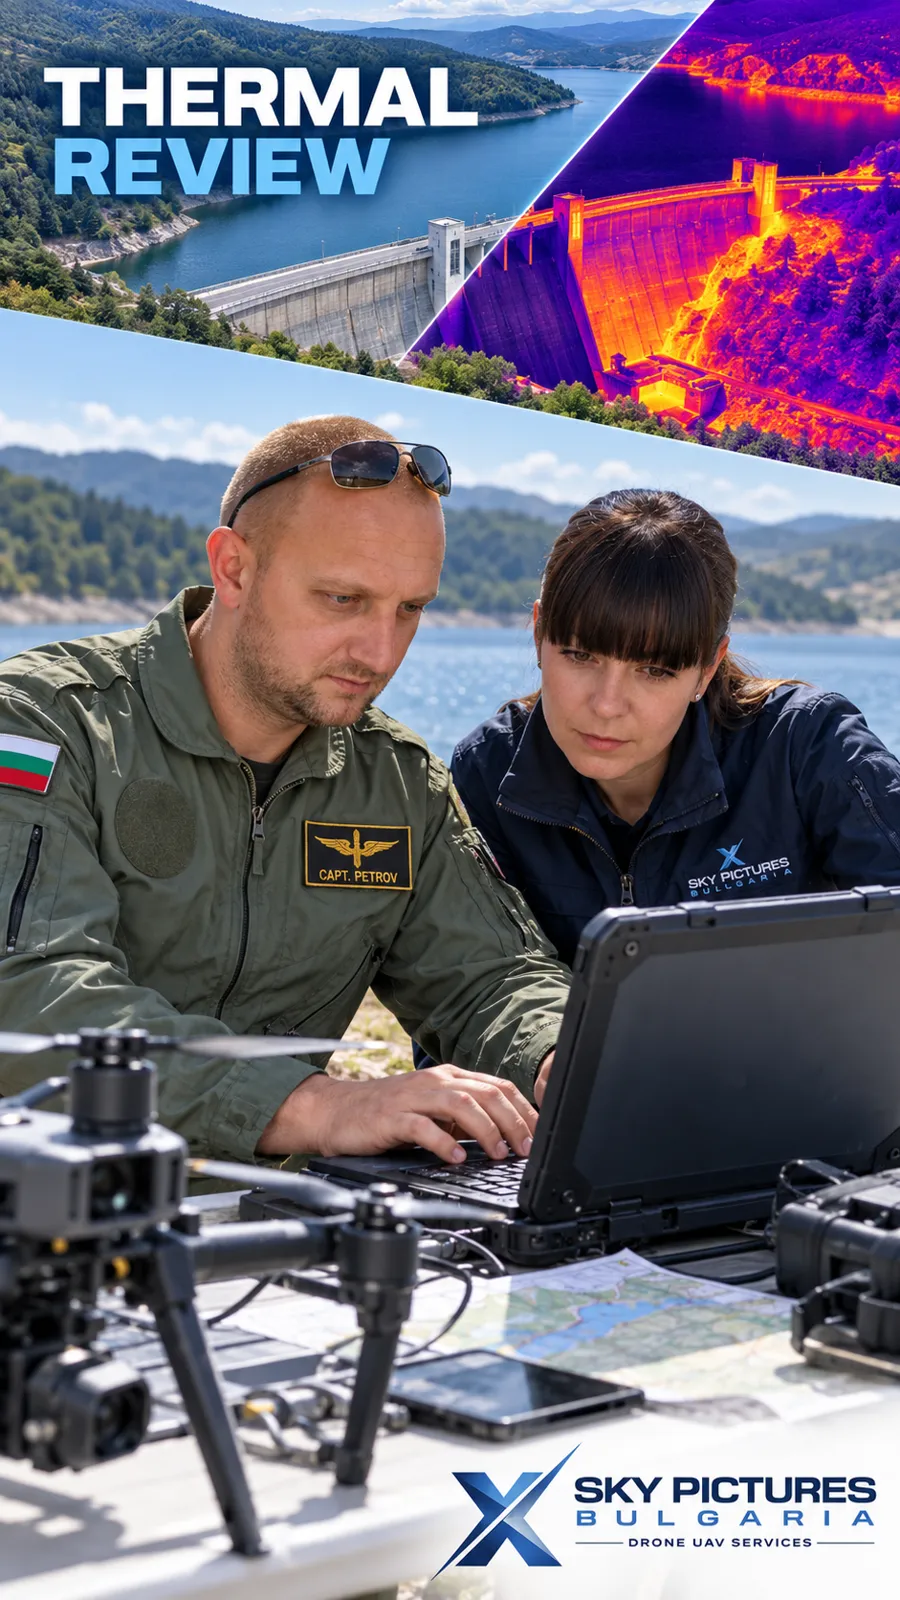
A thermal map shows the spatial distribution of thermal radiation from visible surfaces. Temperature analysis is also possible when suitable radiometric data and processing are available.
It can support monitoring of:
- Heating and cooling of construction materials and surfaces;
- Temperature differences during concrete placement and subsequent curing;
- Uneven heating of roofs, paved surfaces and industrial areas;
- Thermal anomalies in equipment and infrastructure;
- Areas requiring further investigation for moisture, heat loss or other deviations.
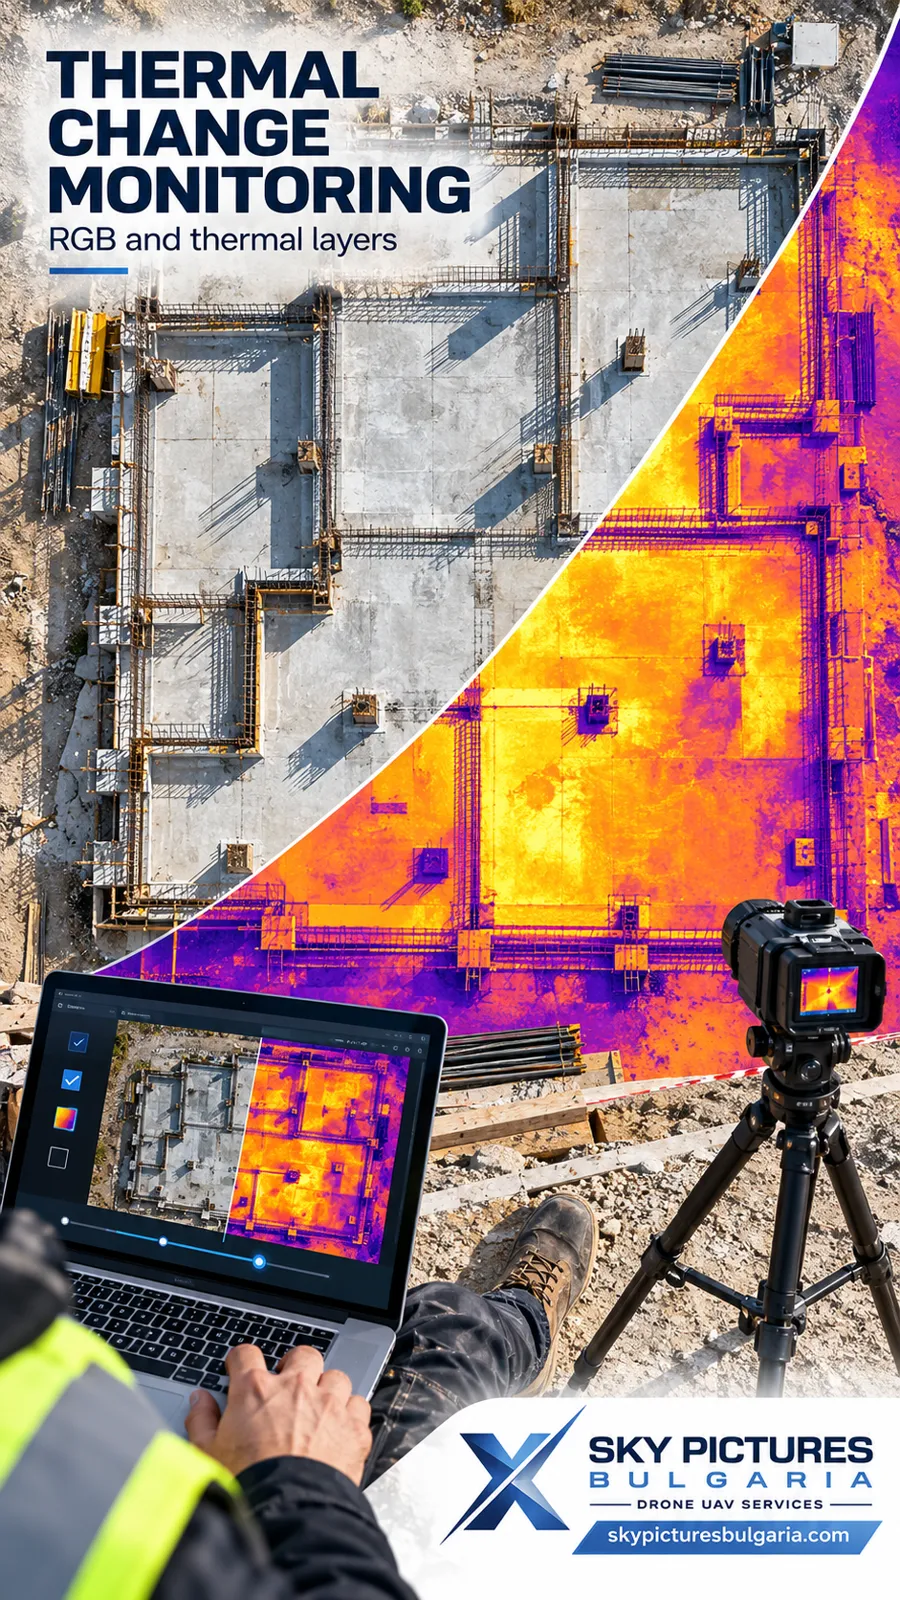
RGB and thermal maps can be viewed together, for example using transparency, a comparison slider or parallel views. This links an observed thermal feature to its precise location and the visible condition of the site.
Comparable thermal analysis takes account of acquisition conditions, solar heating, humidity, reflections and material emissivity. A colour thermal visualisation alone does not guarantee that measurable temperatures are available for every pixel.

Orthophoto time lapse
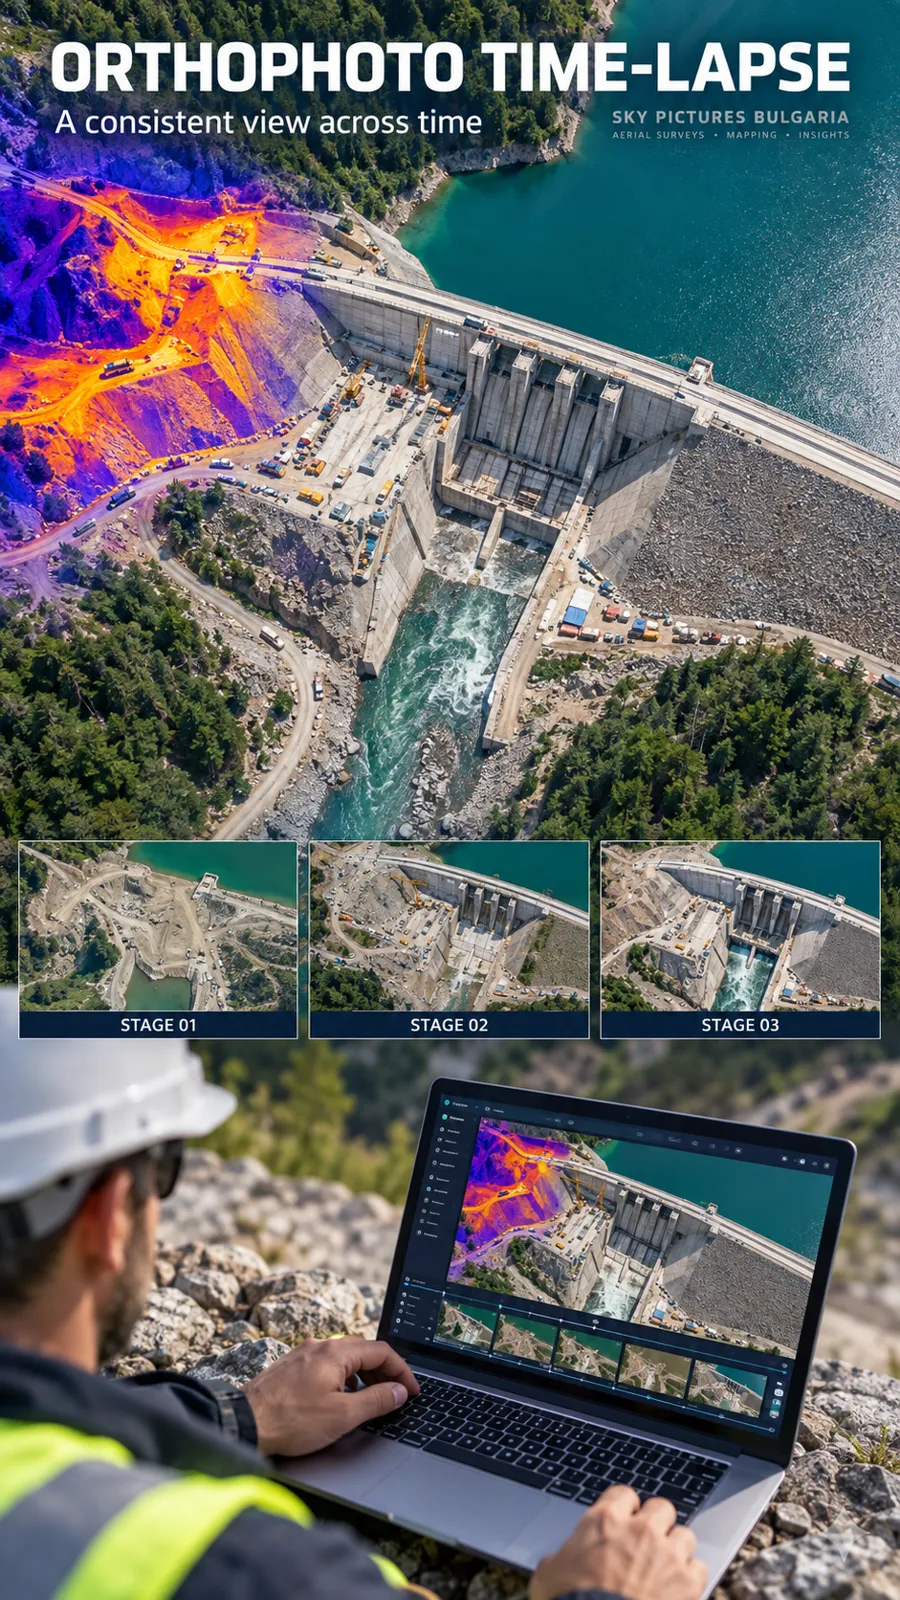
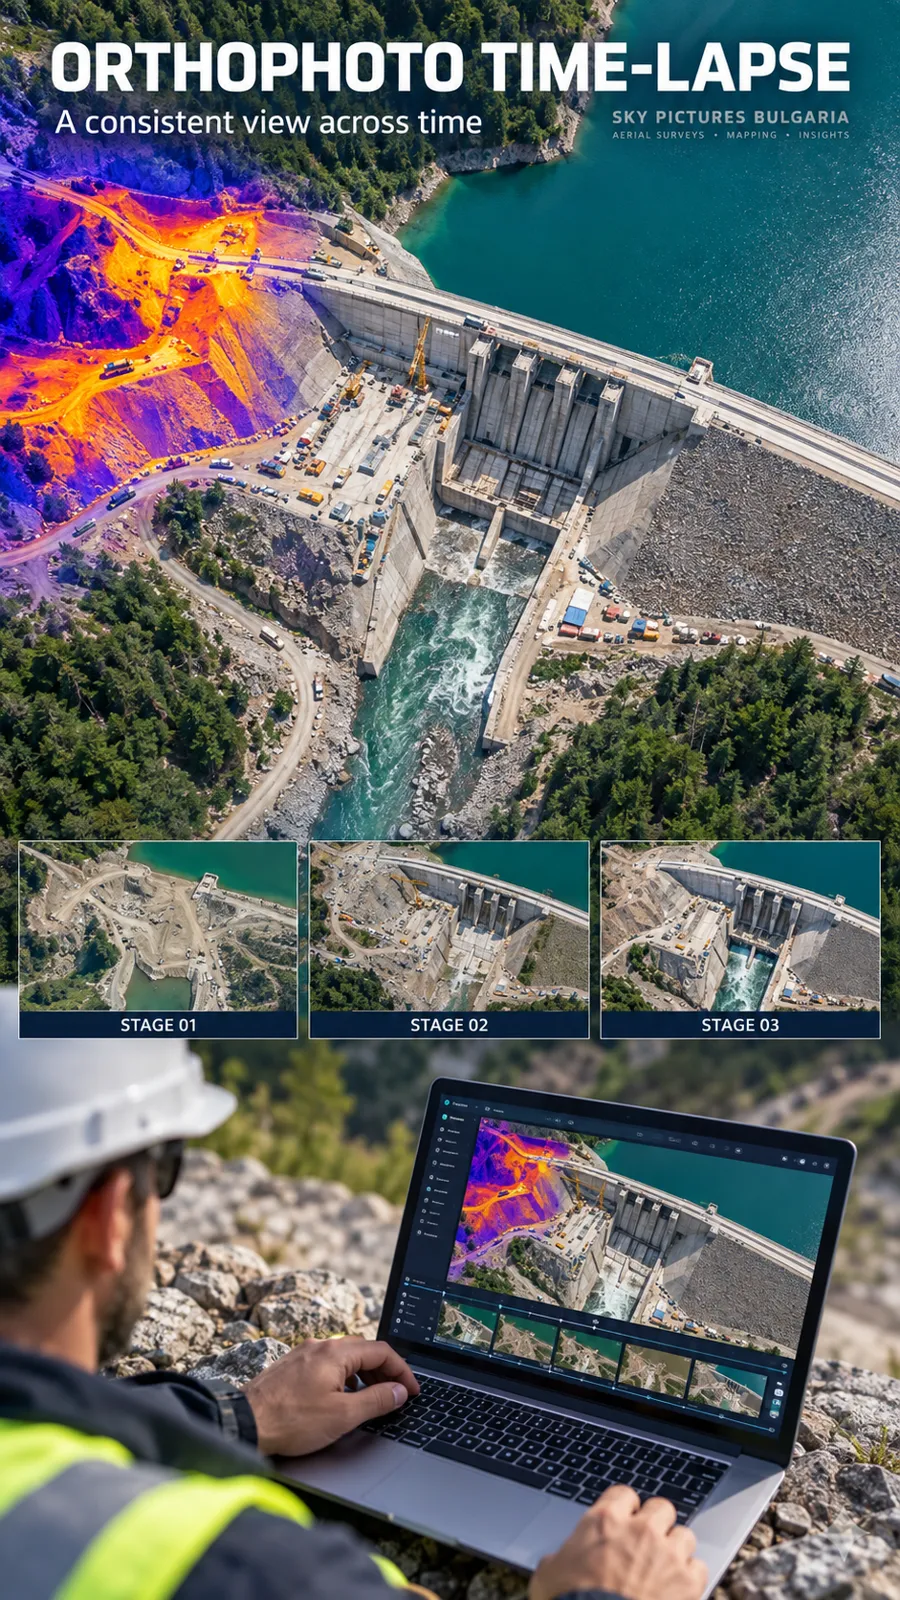
An orthophoto time lapse is a video created from successive orthophoto maps of the same area.
Unlike a time lapse recorded by a stationary camera looking across a site, this approach observes the site vertically from above within a comparable mapping frame.
(Imagine a satellite view in which the dates change while foundations, buildings, roads, storage areas and new structures gradually appear before your eyes.)
We can produce:
- RGB orthophoto time lapse — showing the visible development of the site;
- Thermal orthophoto time lapse — showing changes in the thermal pattern;
- Combined RGB and thermal time lapse — using a split screen, overlays or alternating image types;
- Video with analytical annotations — dates, outlined areas, explanations and results of completed measurements;
- Detailed sequences for selected areas — such as a particular foundation, storage area, roof or construction stage.
The presentation can resemble observation from a satellite, while the imagery is captured by drone. Where required, the video can zoom into individual areas and return to the overall site view.
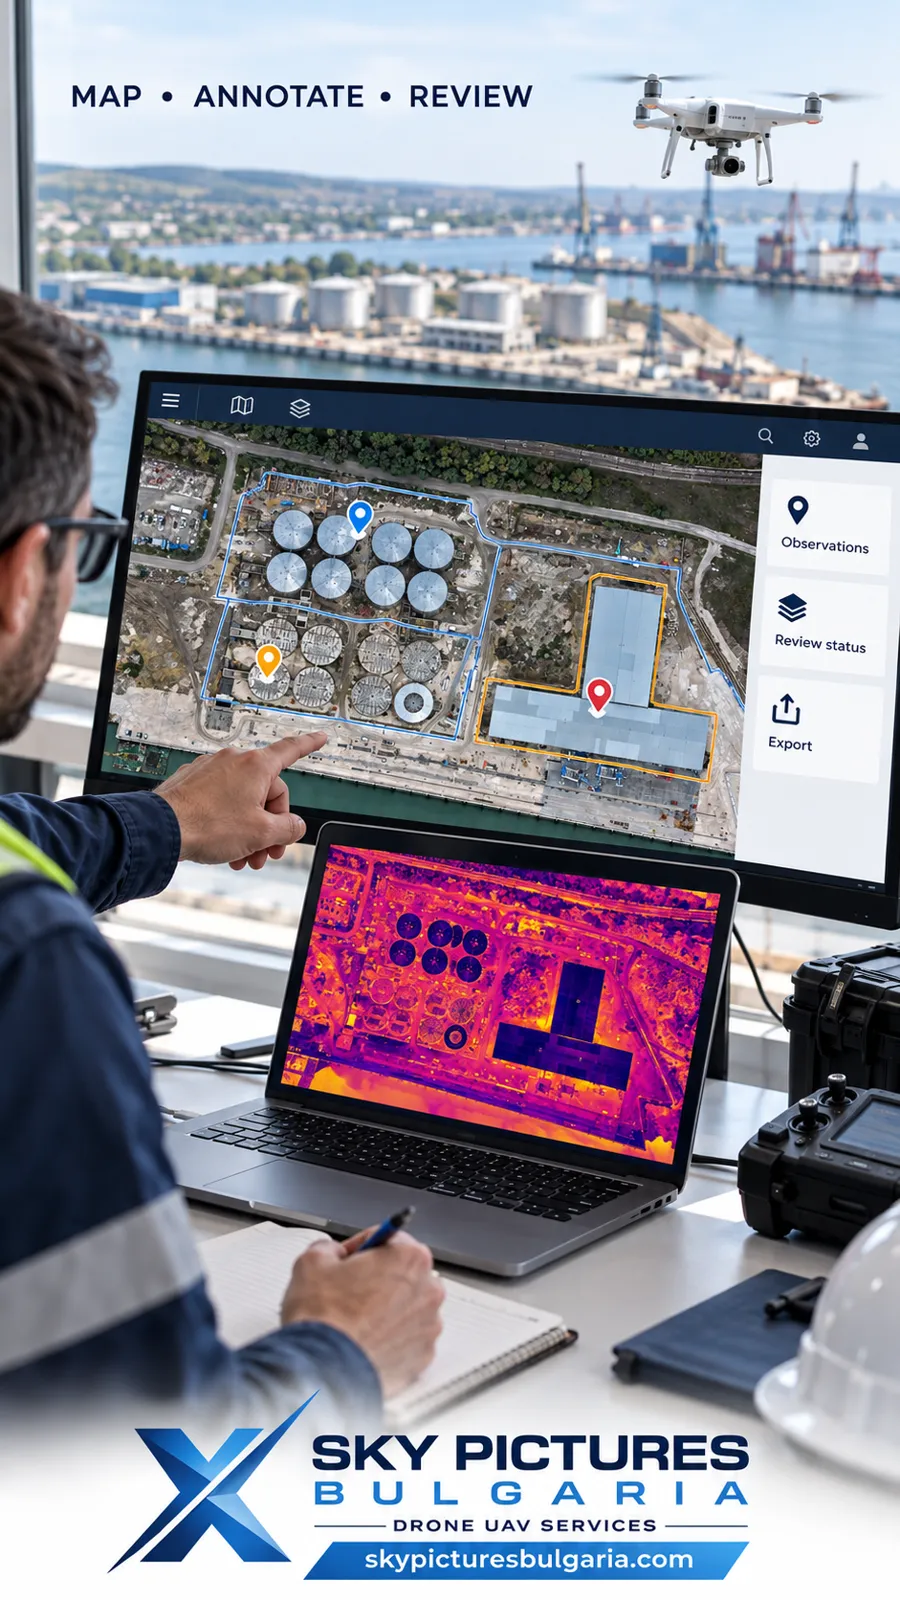
A custom application for review and analysis
In addition to video, we can develop an application tailored to the site, the available data and the client’s workflow.
It organises surveys in a shared environment where users can explore the site’s history, compare selected dates and record observations.
Depending on the brief, the application can include the following modules.
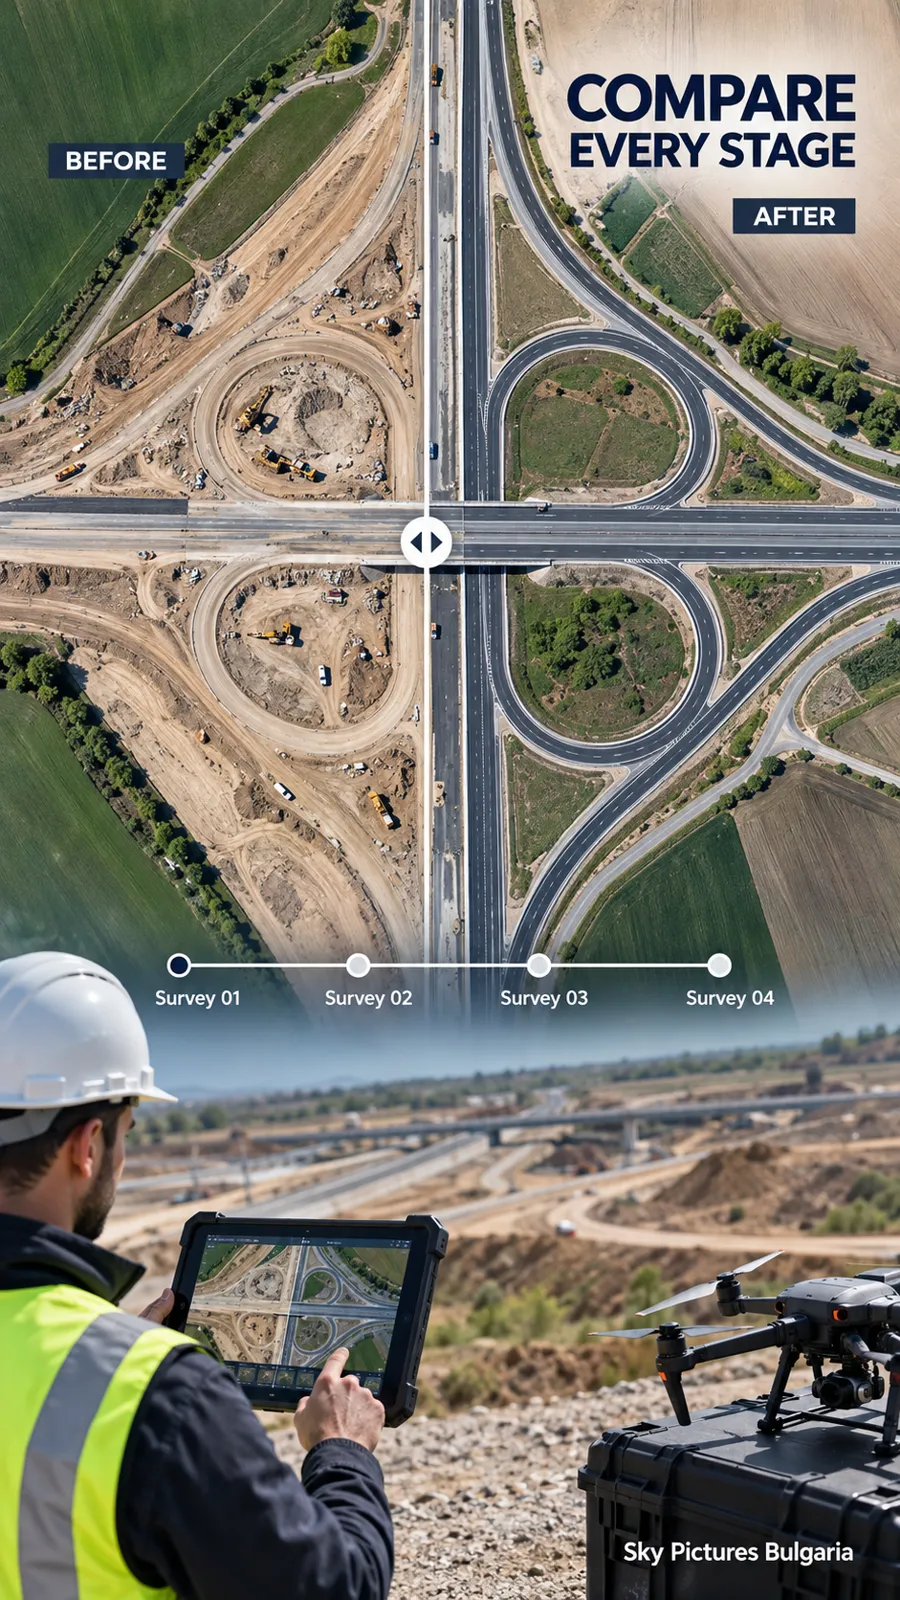
Date selection and chronology
- A calendar or timeline of available surveys;
- Selection of a specific date and map type;
- Sequential navigation through individual stages;
- Retention of the same position and scale when switching dates;
- Access to source and survey information.
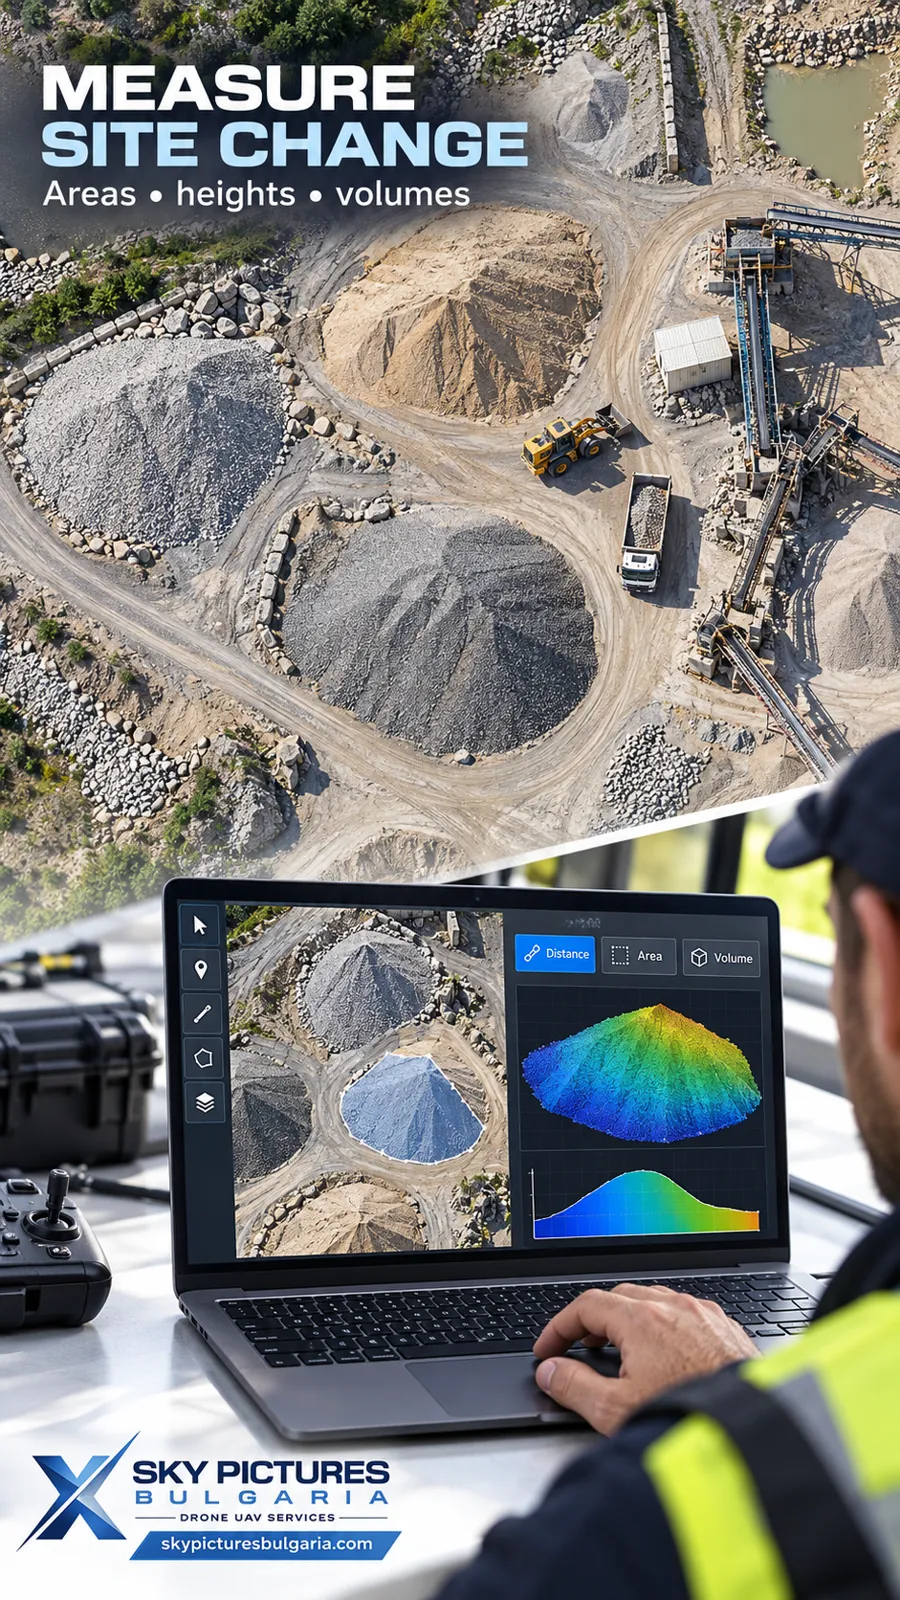
Before and after comparison
- A slider between two selected maps;
- Overlays with adjustable transparency;
- Synchronised parallel views;
- Switching between RGB and thermal layers;
- Comparison of the whole site or a selected area.
(For example, you can examine the same foundation before and after concrete placement, or compare the location and dimensions of a material stockpile between two visits.)
Notes and change records
- Placing markers on the map;
- Outlining sections and work areas;
- Adding descriptions associated with a specific date and location;
- Attaching photographs and documents where specified;
- Categorising observations;
- Assigning a status such as “to be checked”, “under monitoring” or “closed”;
- Exporting findings and saved geometries.
The map becomes a working site log, in which each observation has a spatial location and a time reference.
Organisation and access
Depending on the project, the solution can be delivered as a local HTML application, a web application or a system with controlled access. Offline operation, sharing between users and collaborative editing are defined during development.
Measurements and quantitative analysis
Measurement tools are selected according to the task and the available spatial data.
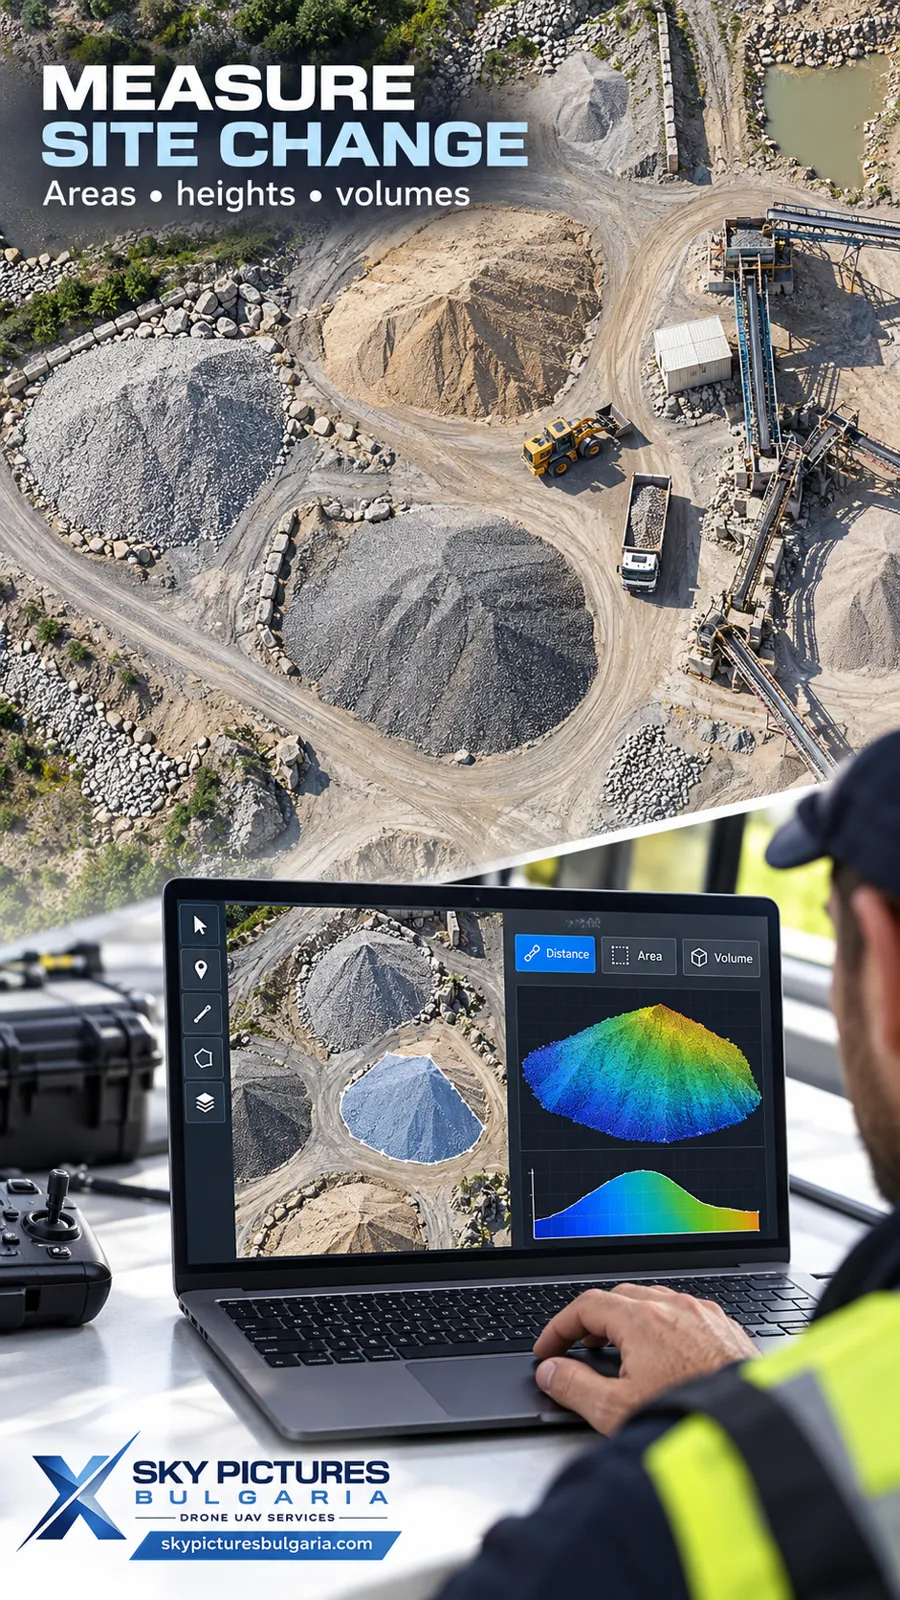
A georeferenced orthophoto supports planimetric measurements of distances and areas. Heights, profiles and volumes require additional elevation data, such as digital models or point clouds. The orthophoto map and the digital model are distinct, complementary products.
Distances and areas
- Measuring distances between selected points;
- Lengths of routes, boundaries and sections;
- Areas of platforms, excavations, paved surfaces and storage zones;
- Comparison of boundaries across different dates;
- Calculation of increases or decreases in occupied area.
Heights and profiles
With a prepared and checked digital model, analysis can cover:
- Stockpile and embankment heights relative to a selected base;
- Elevations and height differences;
- Longitudinal and cross sections;
- Terrain changes between surveys;
- The geometry of open excavations and earthworks.
Volumes and changes in quantities
Suitable models and a defined reference surface enable calculation of:
- Stockpile volumes;
- Cut and fill volumes;
- Quantities added or removed between two surveys;
- Differences between the surveyed condition and a supplied design surface;
- Quantities within individual outlined areas.
(For example, the analysis can show not only whether a stockpile has grown, but the calculated change in its volume between two dates.)
Accuracy is determined for each project according to the survey, ground control, model quality and verification. Measuring volume does not automatically measure weight: converting volume to mass requires appropriate information about the material’s density.
Detecting and tracking changes
The service can combine several types of comparison:
- Visual — what has appeared, moved or disappeared;
- Geometric — how boundaries, distances and areas have changed;
- Elevation — where the surface has risen or fallen;
- Volumetric — what quantities have been added or removed;
- Thermal — how temperature distribution has changed under comparable conditions.
Comparison can be manual, software assisted or automated for specific tasks. Automated analysis results are checked to distinguish actual changes from the effects of shadows, reflections, vegetation or differences between surveys.
Where the service is used
Construction and infrastructure
Monitoring residential, public and industrial construction, roads, railway routes, bridge approaches, platforms and utility infrastructure.
Ports and coastal structures
Documenting the construction of quays, terminals, storage areas, shore protection works and associated infrastructure.
Dams and hydraulic structures
Monitoring construction stages, earthworks, embankments, exposed concrete surfaces and changes in surrounding areas.
Industry and energy
Development of factory sites, energy facilities, photovoltaic parks, substations and logistics complexes.
Quarries extraction and storage facilities
Periodic analysis of terrain, excavations, fills and stocks of bulk materials.
Land reclamation and the environment
Monitoring land restoration, erosion, vegetation changes, water boundaries and the consequences of natural events.
How we organise the work
- Define the objectives — what needs to be monitored and which decisions the data will support.
- Set the scope and schedule — area, frequency and key milestones.
- Prepare the spatial reference — coordinate system, ground control and verification criteria.
- Carry out periodic RGB and/or thermal surveys — following an agreed methodology.
- Process and check the data — maps, models and alignment across dates.
- Update the application and analysis — add new surveys and findings.
- Deliver the results — interactive review, video, files and reports according to the brief.
How many surveys can be included
The service is not restricted to a predetermined number of images or dates. The archive can expand throughout the monitoring period, from individual visits to a multi year history of the site.
For large datasets, the application is organised by dates, layers and levels of detail. Capacity, storage and performance are sized to suit the project.
The video can present the complete sequence or selected stages, while the detailed archive remains available in the application.
What the client receives
Depending on the agreed scope, we provide:
- Dated RGB and/or thermal orthophoto maps;
- Digital models and point clouds where required;
- A custom application with selected tools;
- RGB, thermal or combined orthophoto time lapse;
- Comparison maps and visualisations;
- Measurement and quantitative analysis results;
- A register of observations and documented changes;
- Reports and files for further use;
- Information about methodology, accuracy and the limitations of the supplied data.
Benefits for the client
- A clear site history — organised by date and location;
- Remote review — for investors, managers and technical teams;
- Better coordination — through a common mapping reference for discussion;
- Quantitative comparison — when the project includes the necessary measurements and models;
- Documentation of key stages — before subsequent work changes the visible condition;
- Accessible presentation — video for an overview and an application for detailed analysis.
Sky Pictures Bulgaria turns periodic aerial surveys into an organised history of your site, with maps, comparisons and tools that show where, when and how it changes.
Video
OTHER SOLUTIONS
 01
AERIAL DRONE VIDEO SERVICES
Our team is fully certified for any work with unmanned aerial vehicles UAV/Drones…
VIEW MORE 02
VIDEO PRODUCTION SERVICES
Sky Picture Bulgaria provides quality video recording and filming in different video…
VIEW MORE 03
REMOTE MARKETING & INDUSTRIAL VIDEO PRODUCTION
Sky Pictures Bulgaria provides a modern remote production service for marketing,…
VIEW MORE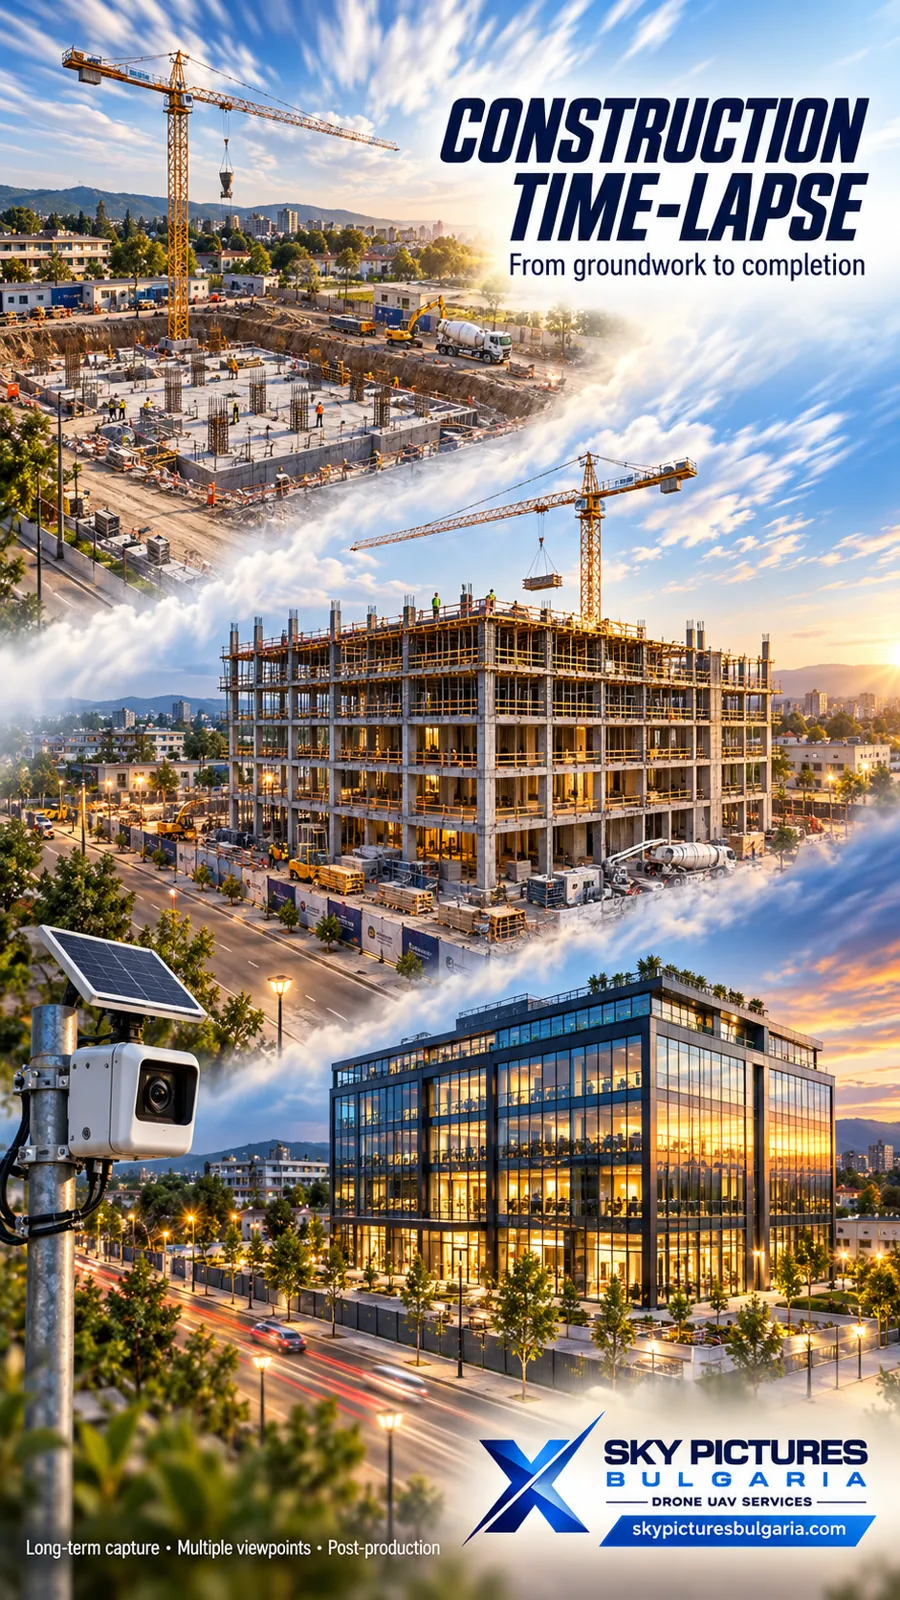 04
TIME LAPSE AND HYPERLAPSE VIDEO PRODUCTION SERVICES
Time-lapse and hyper-lapse filming give a unique and exceptional vision when filming…
VIEW MORE 05
PHOTOGRAPHY
We offer complete solutions in the field of high-quality aerial and terrestrial…
VIEW MORE 06
FPV DRONE VIDEO SERVICES
VIEW MORE 07
THERMAL DRONE INSPECTIONS
Petrov Sky Dynamics is a high-tech company owned by SKY PICTURES BULGARIA working mainly…
VIEW MORE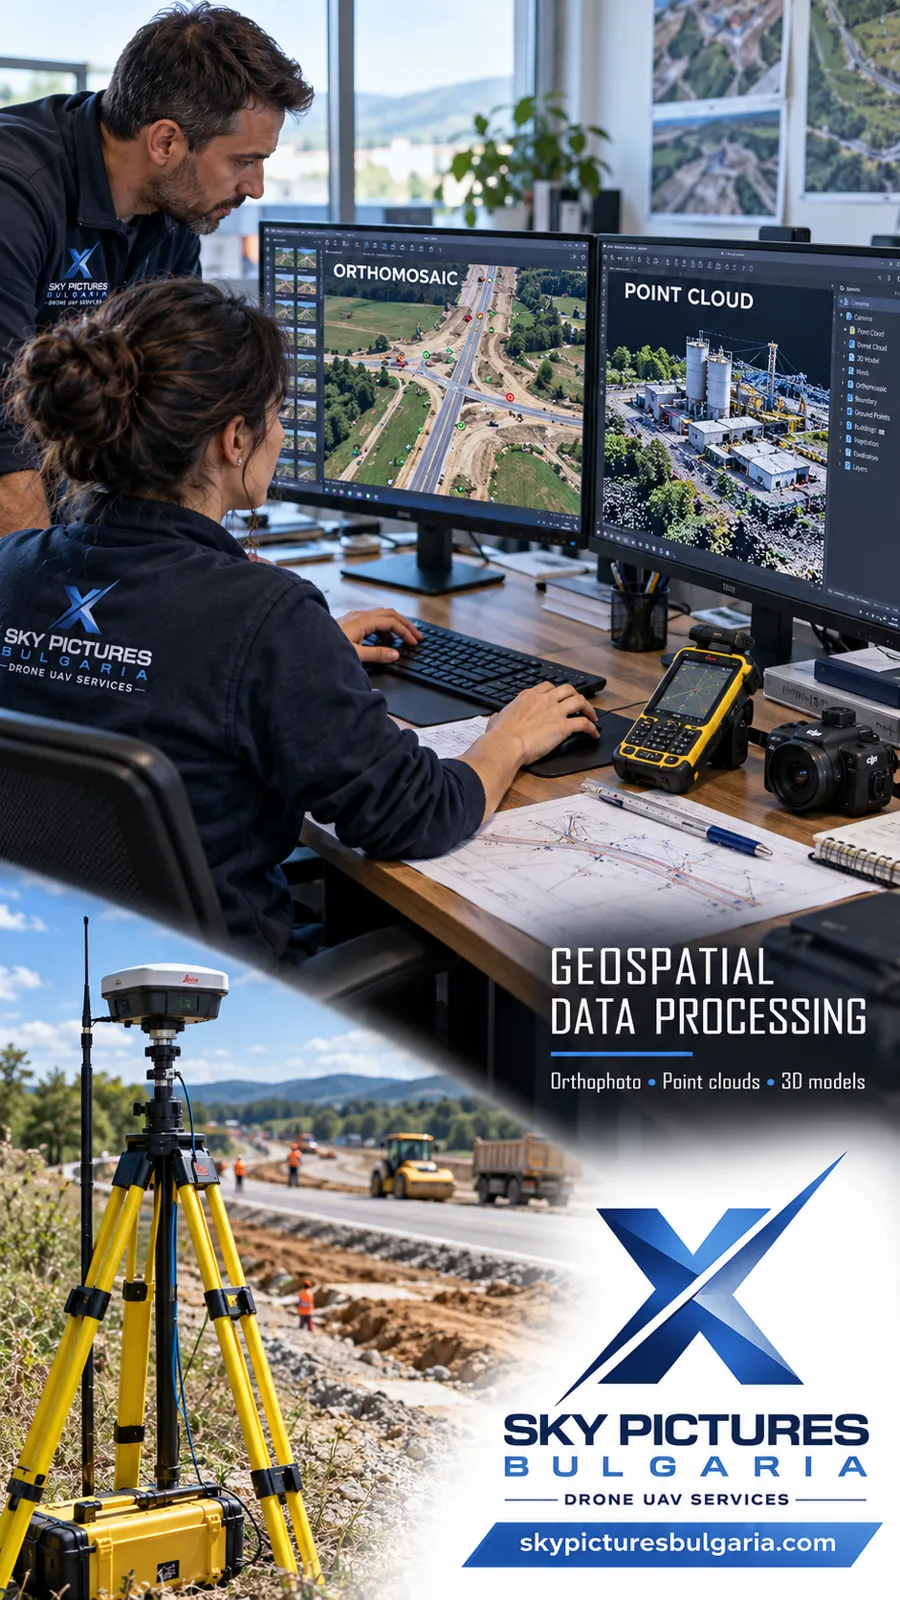 08
GEODETIC AND TOPOGRAPHIC SURVEYING WITH DRONES
VIEW MORE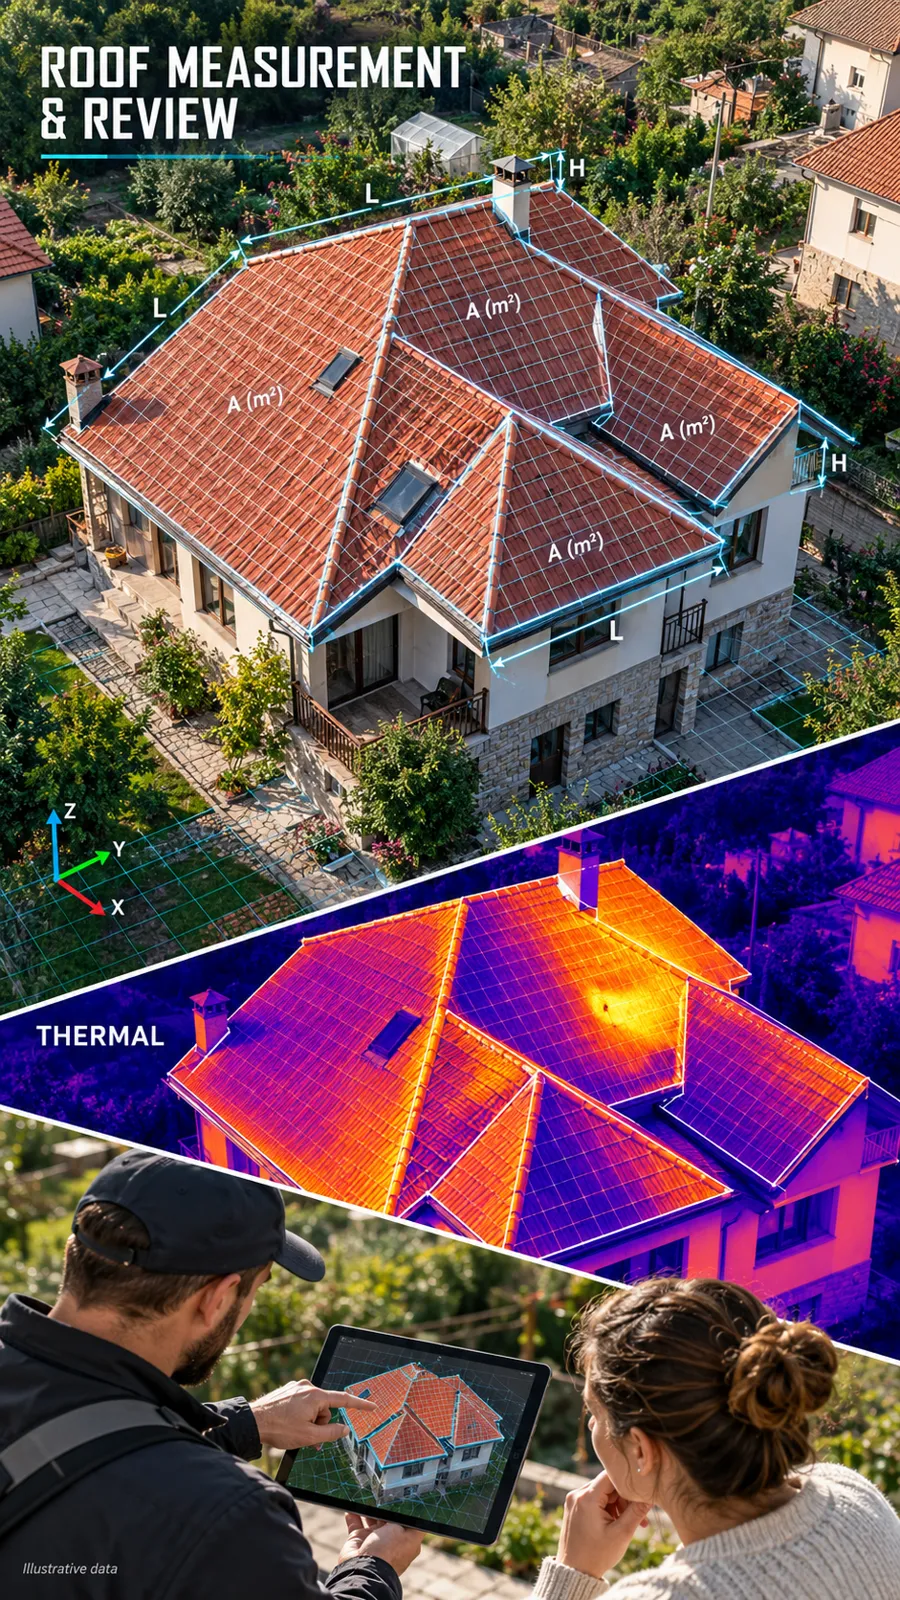 09
MEASUREMENT OF AREAS, VOLUMES, AND DISTANCES WITH INDUSTRIAL DRONES
VIEW MORE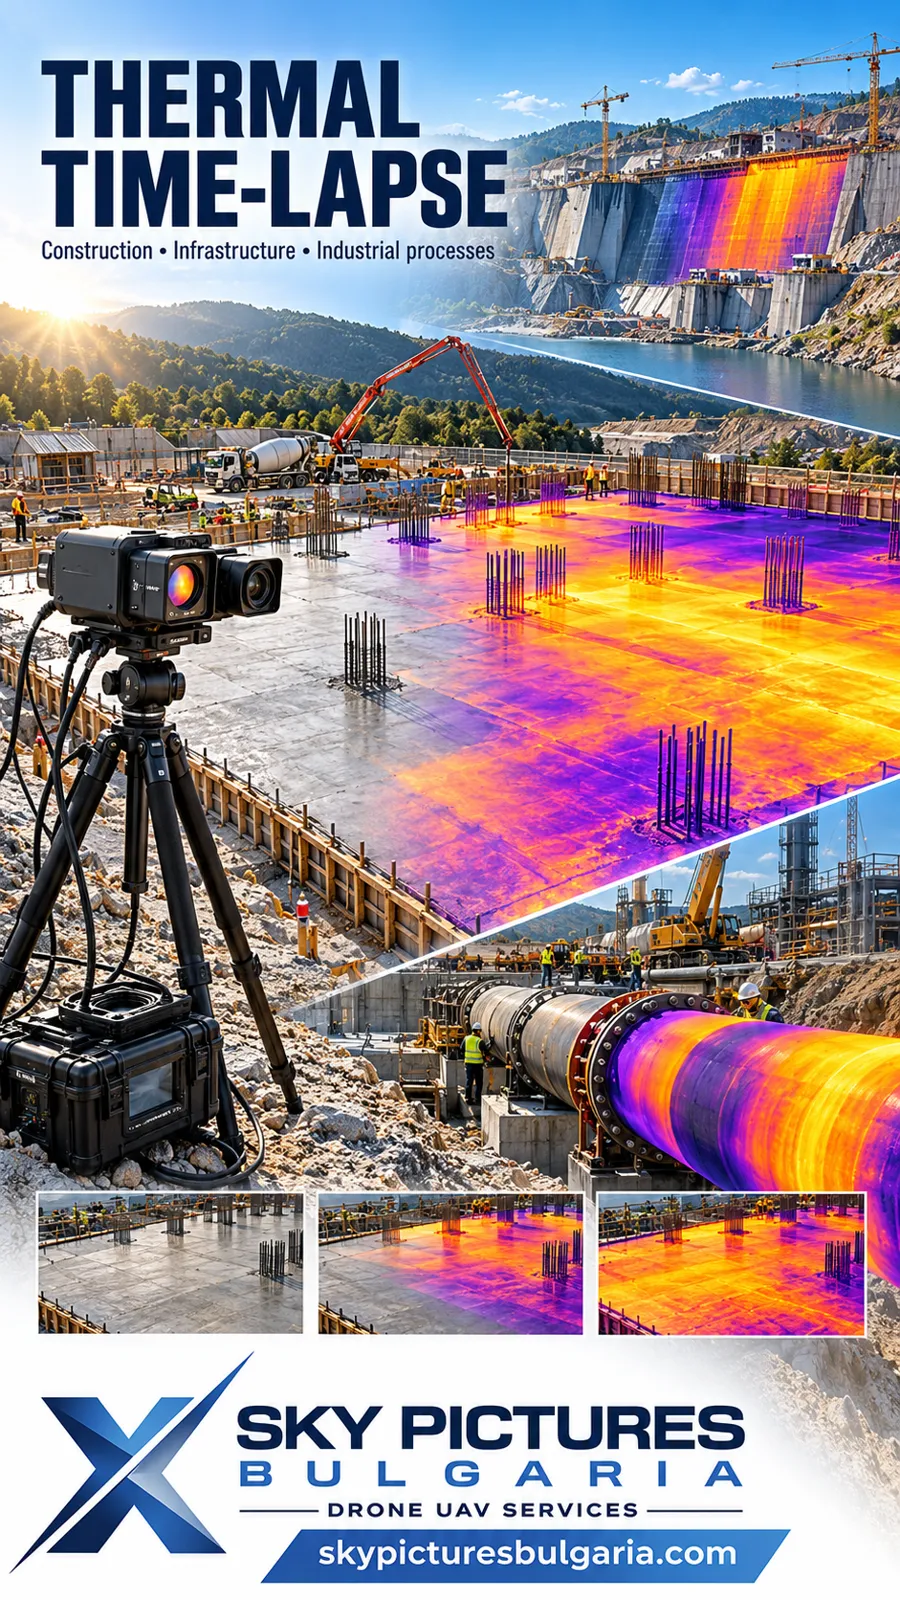 10
THERMAL TIME LAPSE FOR CONSTRUCTION AND INDUSTRIAL PROCESSES
Temperature histories and visual documentation through synchronised thermal and RGB…
VIEW MORE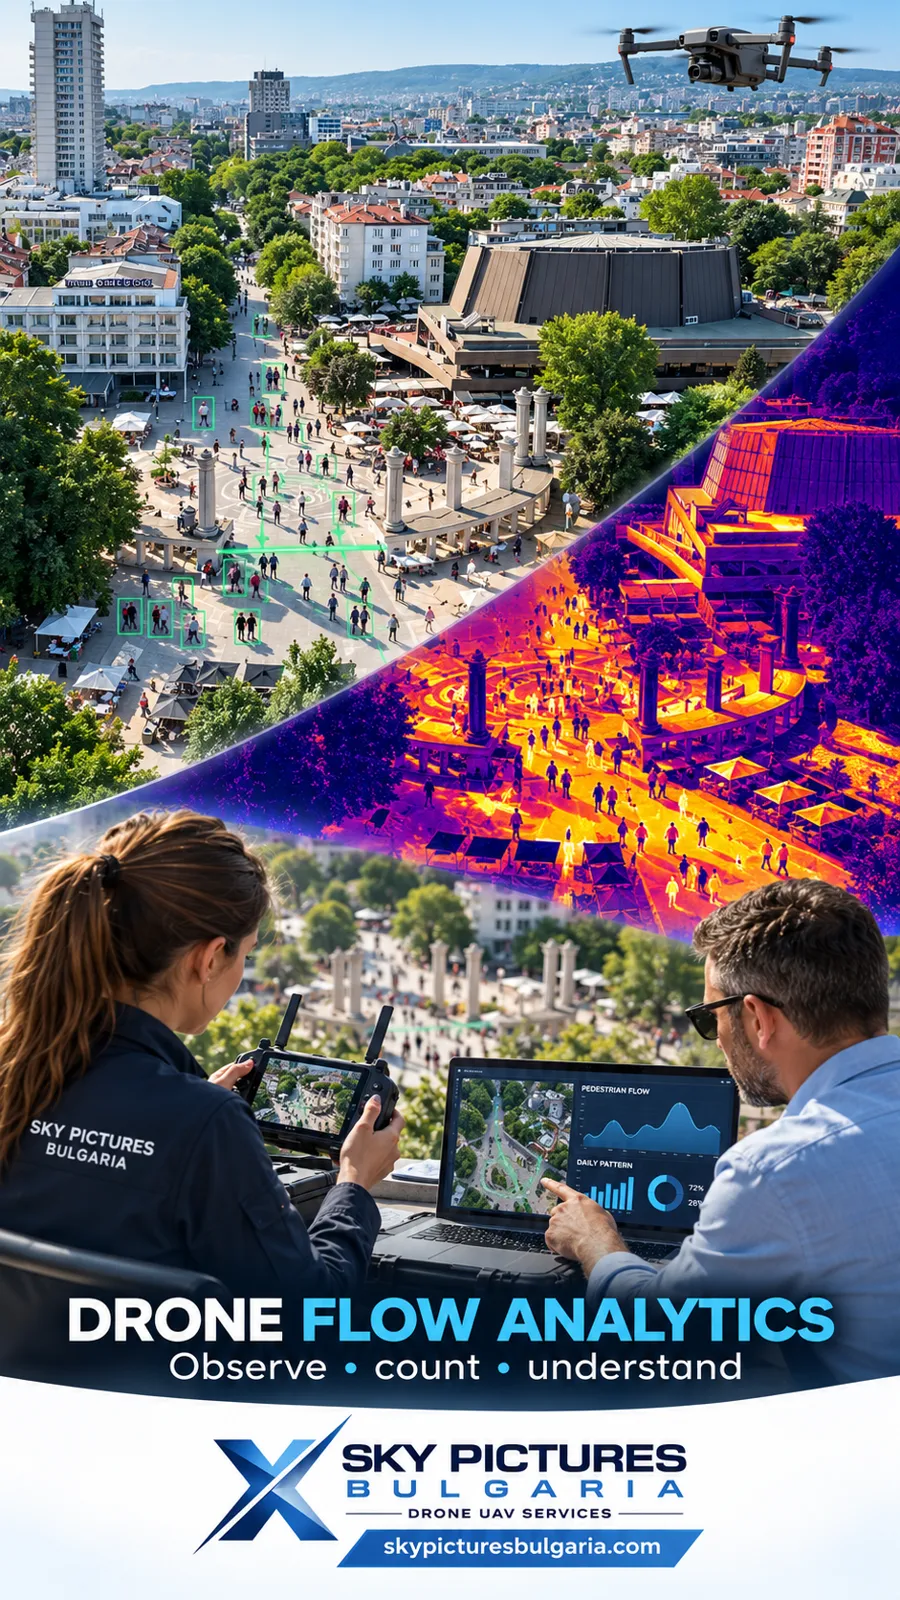 11
DRONE SYSTEMS FOR COLLECTING STATISTICAL DATA ON THE MOVEMENT OF PEOPLE
VIEW MORE 12
DRONE CONSULTING SERVICES
VIEW MORE 13
DRONE PILOT COURSES
VIEW MORE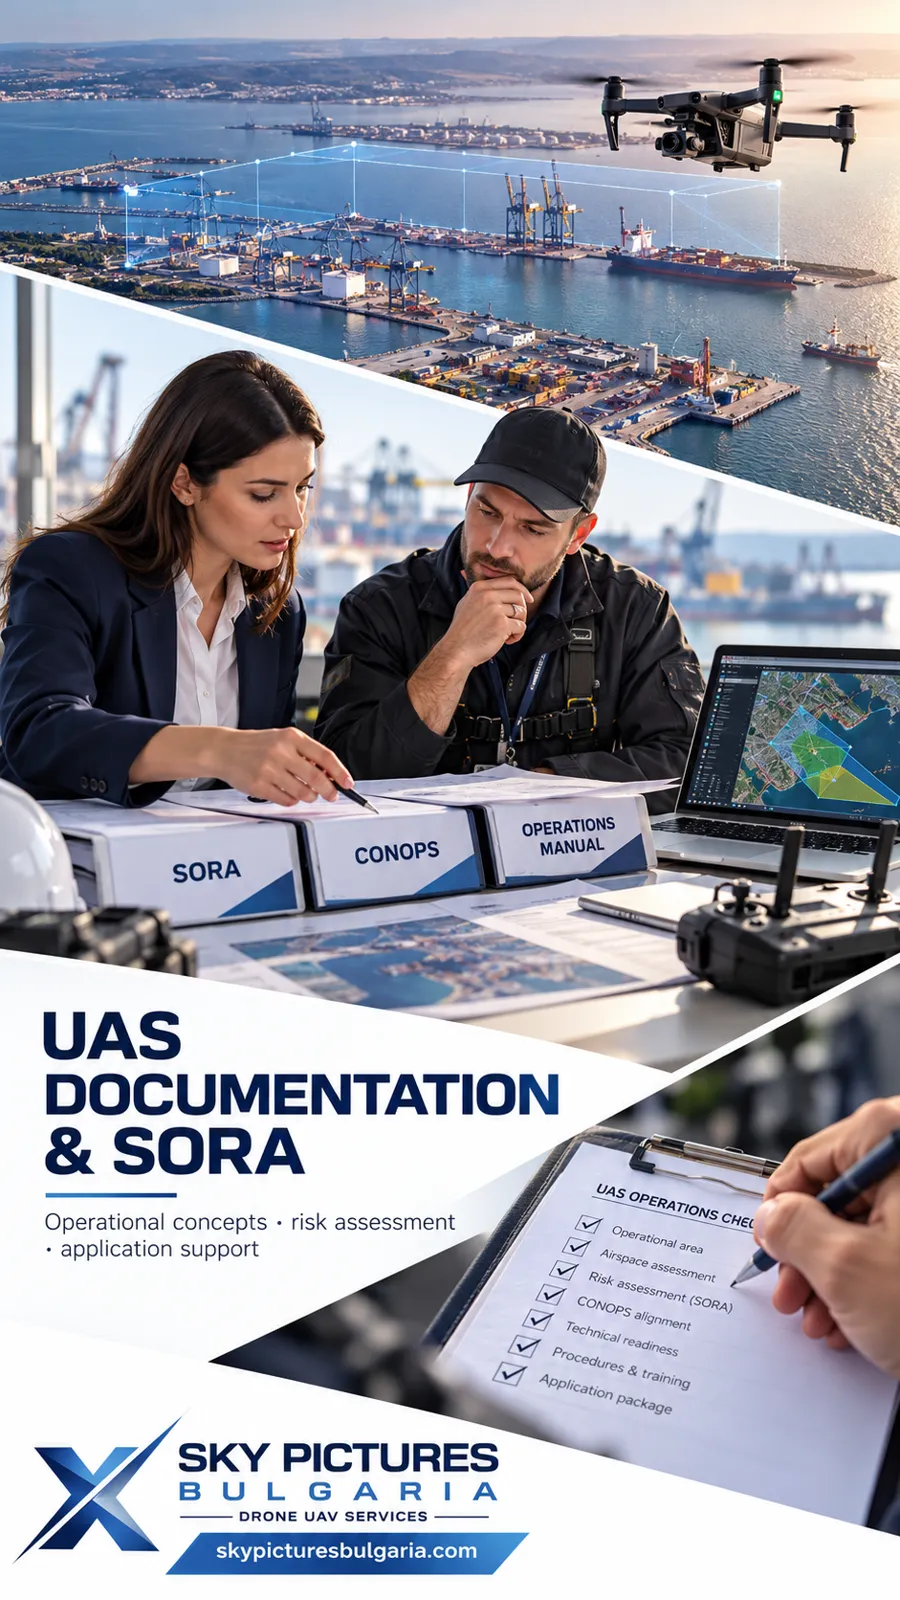 14
SPECIFIC CATEGORY DOCUMENTATION PREPARATION SORA REGULATORY AND OPERATIONAL DOCUMENTATION FOR UNMANNED AIRCRAFT SYSTEMS
Sky Pictures Bulgaria provides professional preparation, development, review and…
VIEW MORE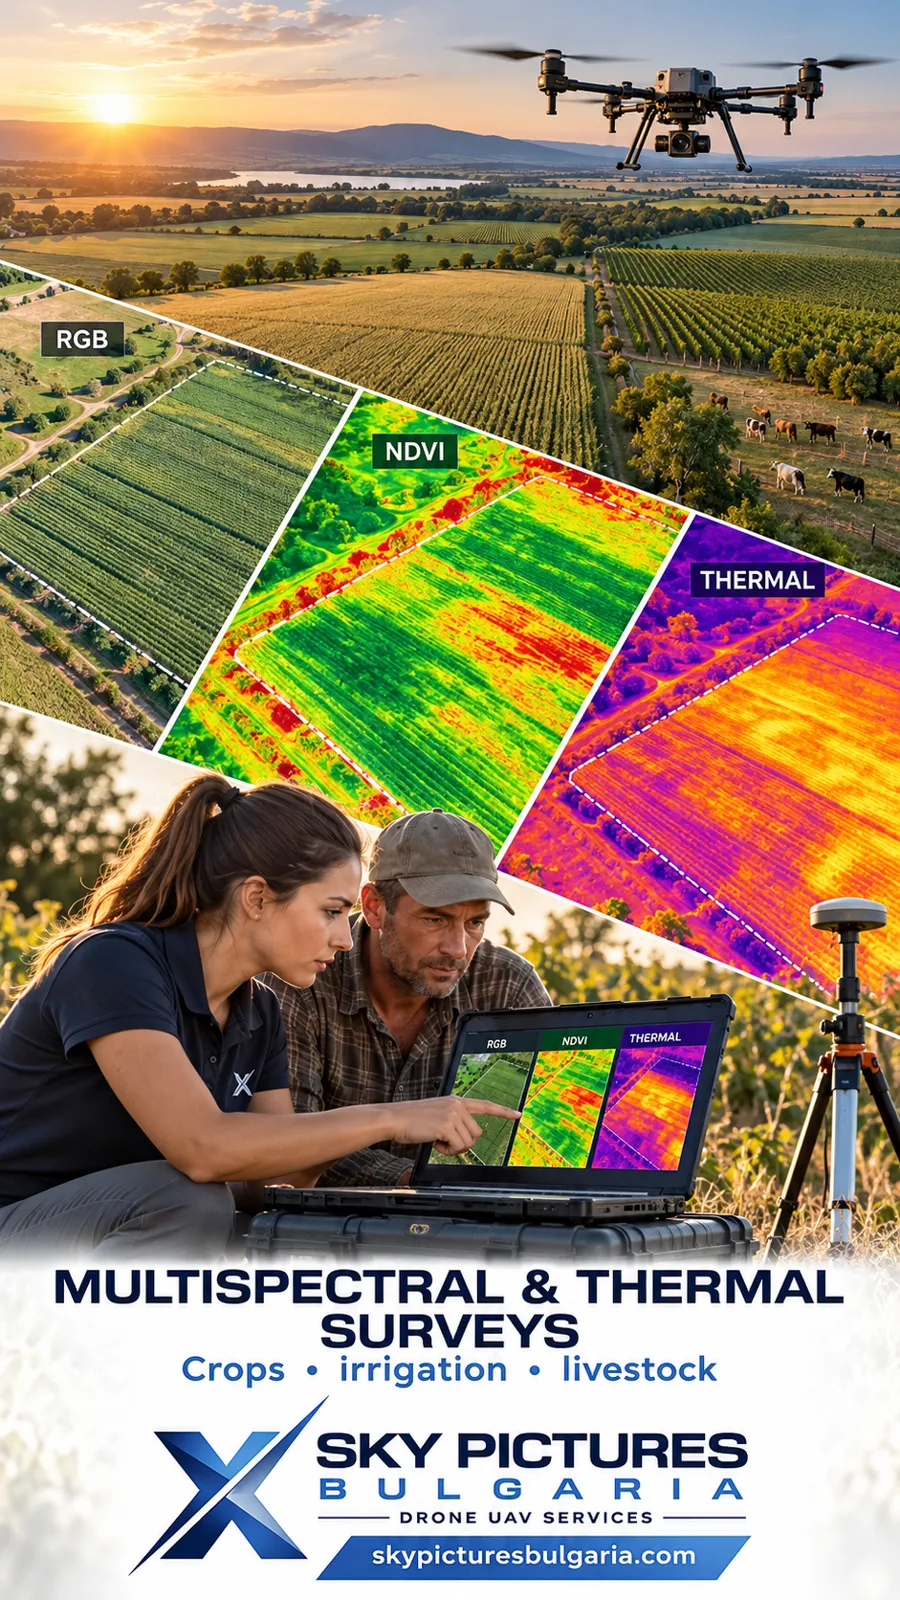 15
MULTISPECTRAL AND THERMAL DRONE SURVEYS FOR AGRICULTURE AND LIVESTOCK
VIEW MORE 16
AGRICULTURE DRONE SERVICES
VIEW MORE 17
SEARCH AND RESCUE ASSISTANCE WITH THERMAL CAMERA DRONES
VIEW MORE 18
HEAVY-LIFT RESCUE DRONE SYSTEMS FOR HUMAN EVACUATION
Sky Pictures Bulgaria designs, develops and integrates heavy-lift unmanned aircraft…
VIEW MORE 19
SEARCH AND RESCUE OF PETS WITH THERMAL CAMERA DRONES
VIEW MORE 20
DRONE SYSTEMS FOR EXHAUST GAS ANALYSIS
VIEW MORE 21
DRONE ASSISTANCE FOR MARINE TRANSPORT UNDER LOW VISIBILITY CONDITIONS
VIEW MORE 22
UNDERWATER SURFACE DRONE SYSTEMS FOR INSPECTIONS AND MONITORING ROV AUV USV
VIEW MORE 23
CARGO TRANSPORTATION WITH DRONES – FROM 1 GRAM TO 100 KG
VIEW MORE 24
EVTOL INTELLIGENT ULTRA-LIGHT ELECTRIC AIRCRAFTS ANTG
ANTG-X6 is a single-seat, fully electric Vertical Take-Off and Landing (eVTOL) aircraft…
VIEW MORE 25
EVTOL VERTIPORTS INFRASTRUCTURE AND ADVANCED AIR MOBILITY
Sky Pictures Bulgaria plans, engineers and integrates end-to-end ecosystems for future…
VIEW MORE 26
SELL OF PROFESSIONAL DRONES
VIEW MORE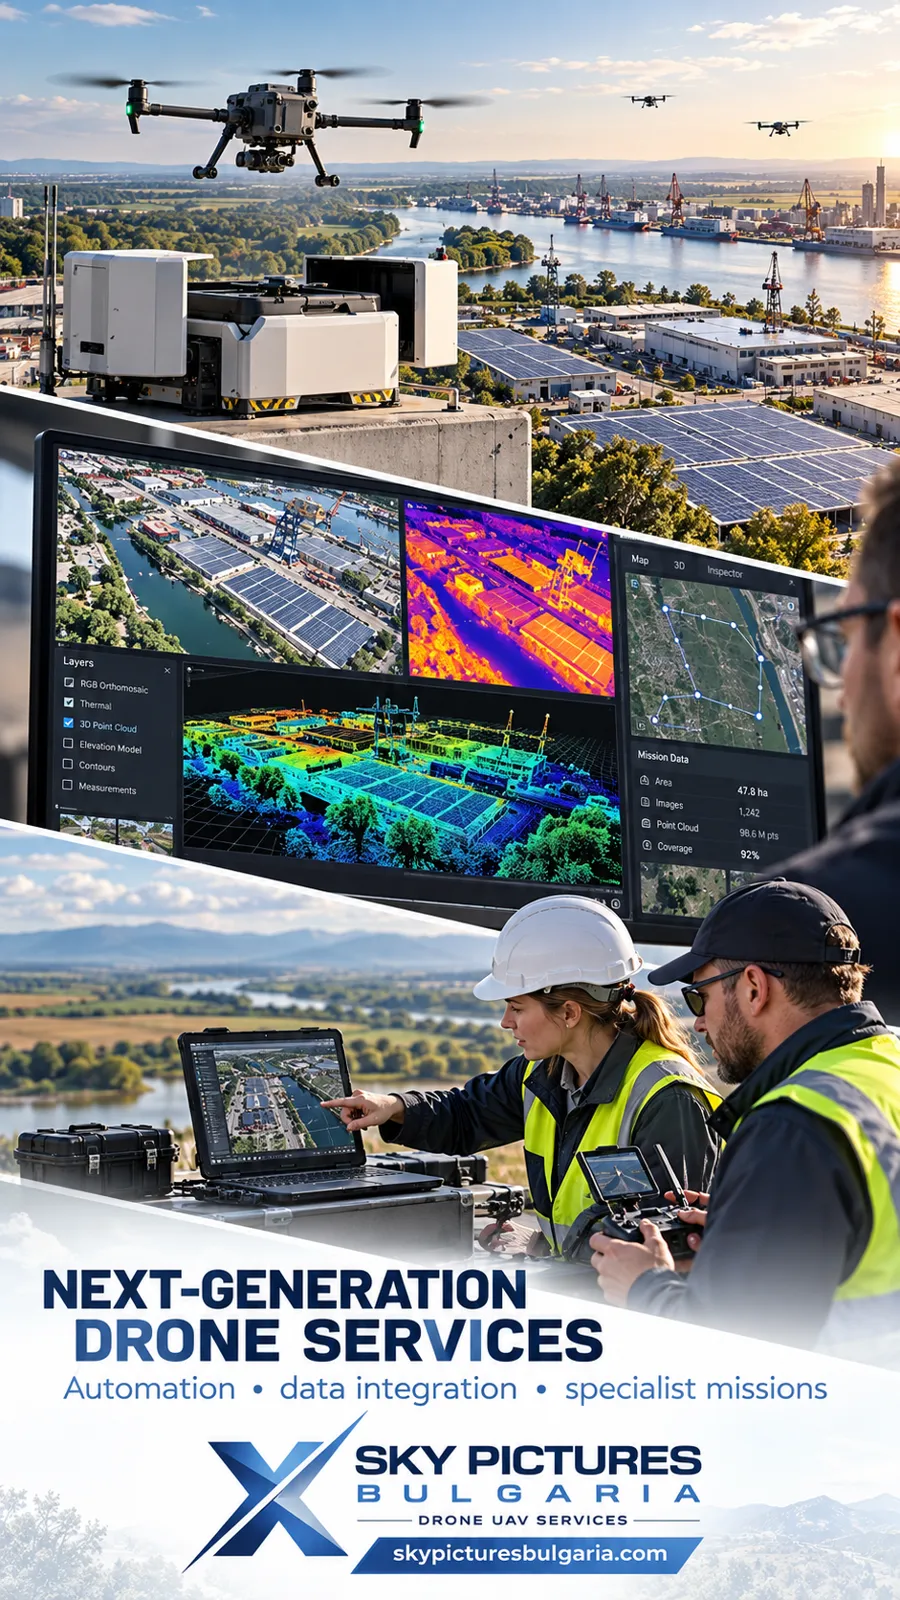 27
NEW INNOVATIVE AND HIGH-TECH DRONE SERVICES
VIEW MORE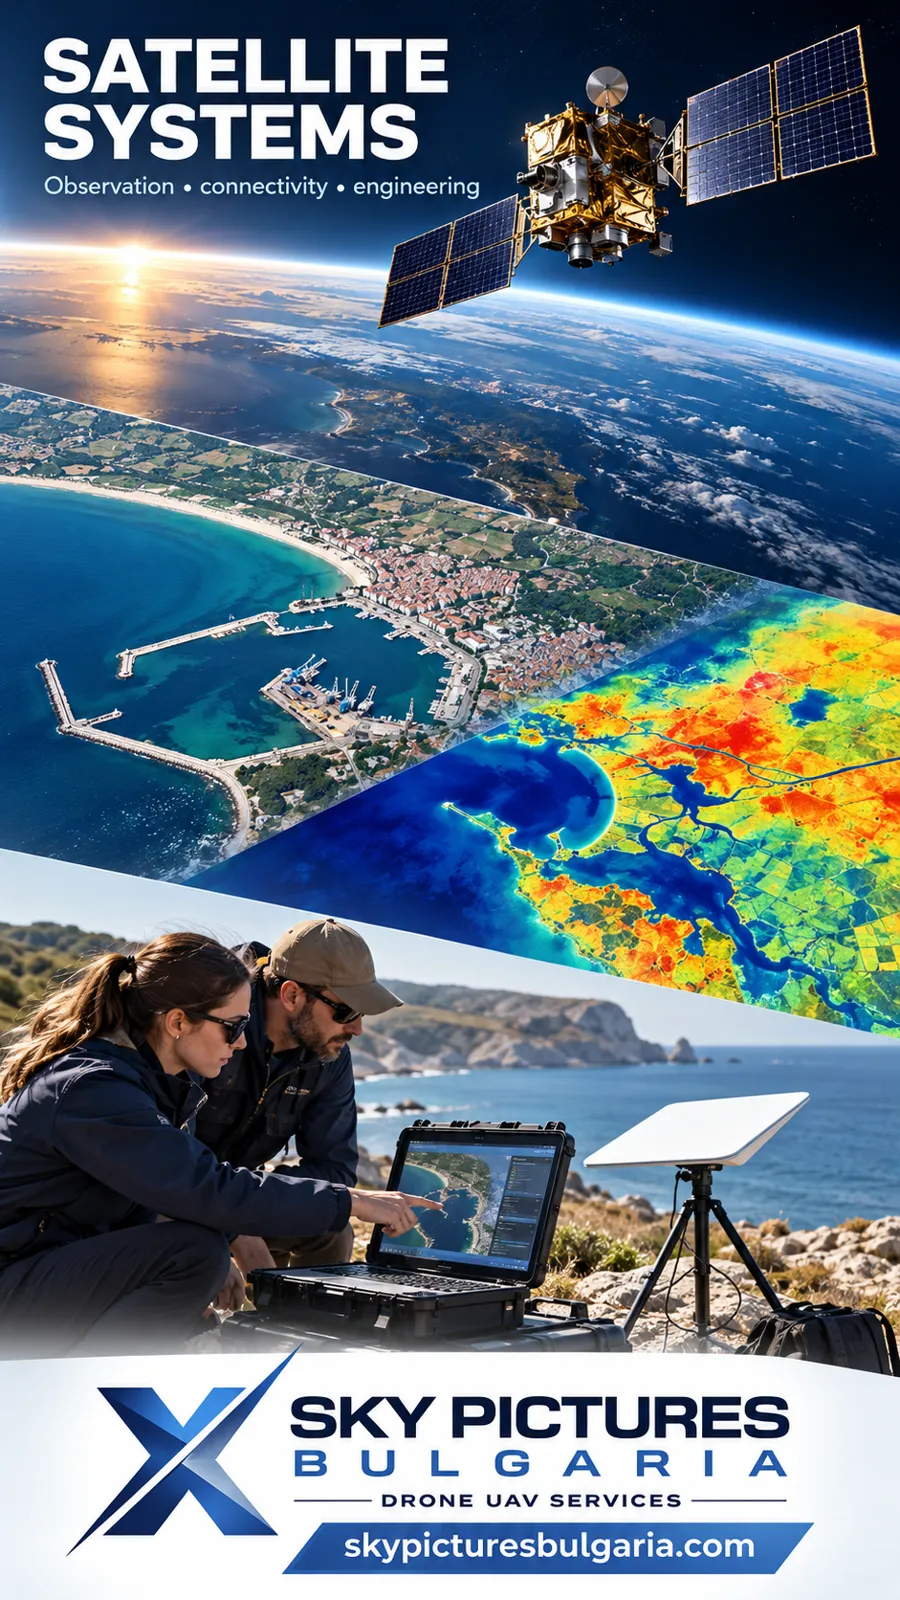 28
SATELLITE IMAGING, SATELLITE SYSTEM DESIGN, AND CONNECTIVITY FOR REMOTE AREAS SATELLITE INTERNET NETWORKS
VIEW MORE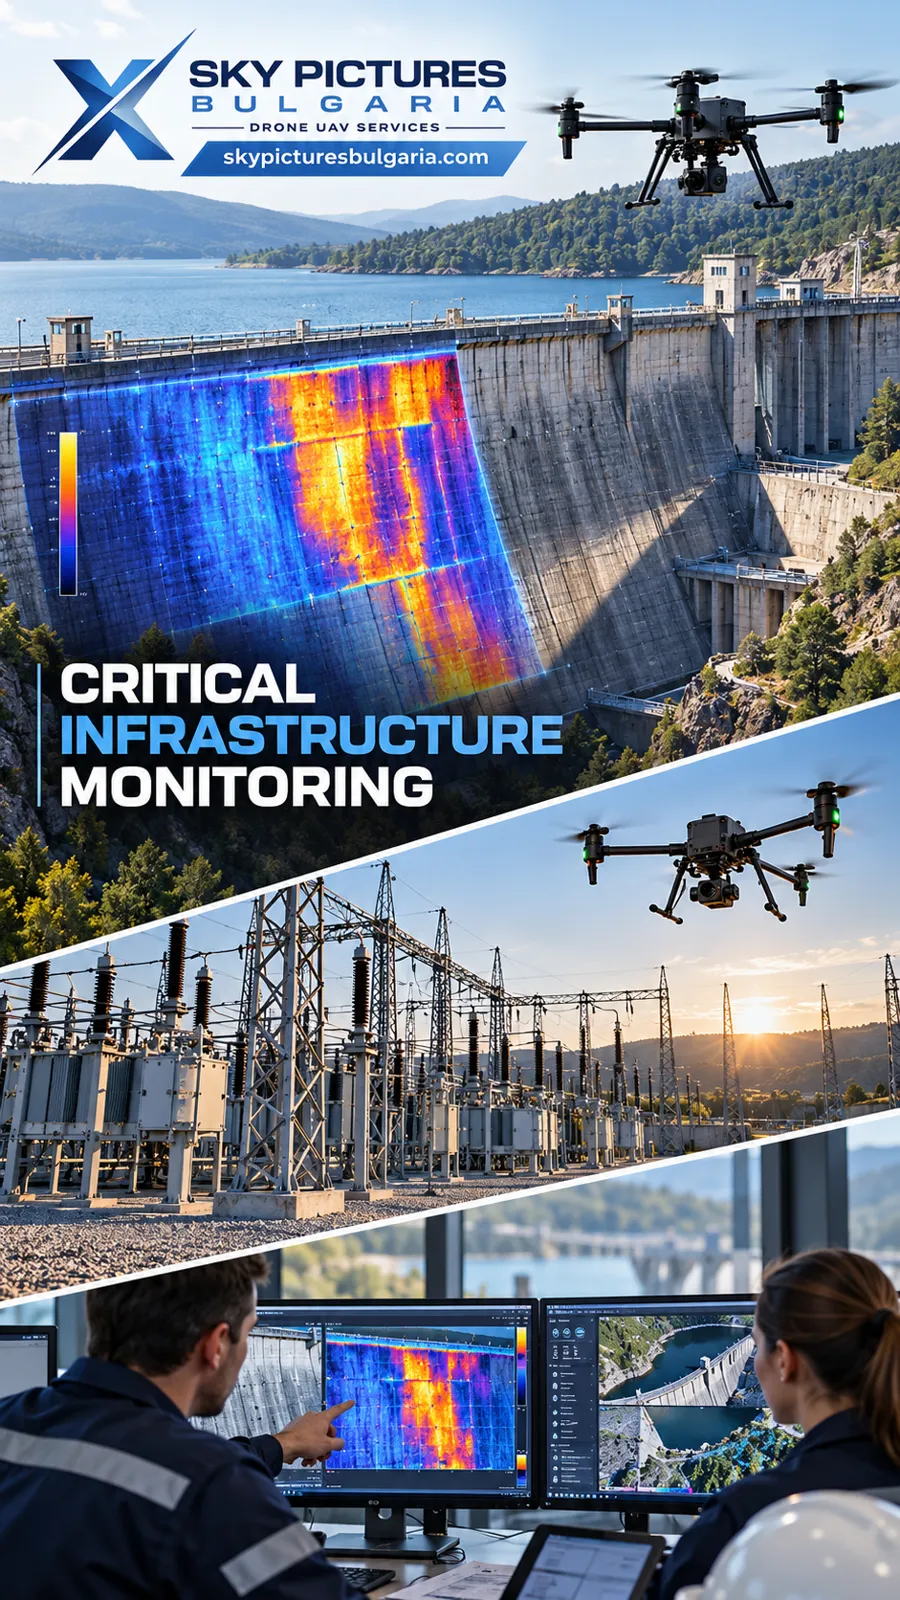 29
MONITORING AND PREDICTIVE INFRASTRUCTURE PLATFORMS
Next-Generation Solutions for Autonomous Monitoring, Digital Twins, Artificial…
VIEW MORE